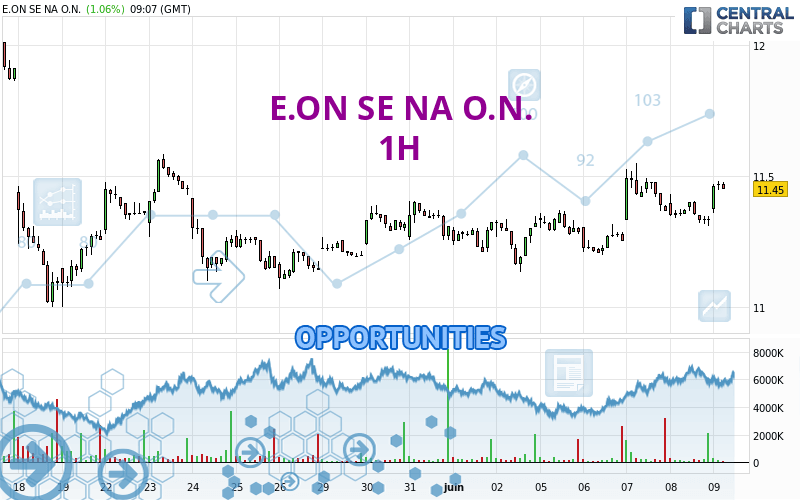
Londinia Opportunities Analyses - 06/09/2023 (GMT) E.ON SE NA O.N. - 1H
| Type: | Stocks |
| Ticker: | EOAN |
| ISIN: | DE000ENAG999 |
- Europe Stocks
- Timeframe : 1H
- - Analysis generated on
- Status : INVALID
Summary of the analysis

Additional analysis
Quotes
The E.ON SE NA O.N. rating is 11.470 EUR. The price has increased by +1.24% since the last closing with the lowest point at 11.360 EUR and the highest point at 11.480 EUR. The deviation from the price is +0.97% for the low point and -0.09% for the high point.The Central Gaps scanner detects a bullish opening. A small advantage for buyers in the very short term.
Bullish opening
Type : Bullish
Timeframe : Openning
So that you have an overall view of the price change, here is a table showing the variations over several periods:
Near a new HIGH record (5 years)
Type : Bullish
Timeframe : Weekly
Near a new HIGH record (1 year)
Type : Bullish
Timeframe : Weekly
Near a new HIGH record (1st january)
Type : Bullish
Timeframe : Weekly
Near a new LOW record (1 month)
Type : Bearish
Timeframe : Weekly
Technical
Technical analysis of this 1H chart of E.ON SE NA O.N. indicates that the overall trend is strongly bullish. 92.86% of the signals given by moving averages are bullish. This strongly bullish trend is supported by the strong bullish signals given by short-term moving averages. The Central Indicators market scanner is currently detecting several bullish signals that could impact this trend:
Bullish trend reversal : adaptative moving average 20
Type : Bullish
Timeframe : 1 hour
Bullish trend reversal : adaptative moving average 50
Type : Bullish
Timeframe : 1 hour
In fact, 15 technical indicators on 18 studied are currently bullish. Caution: the Central Indicators scanner currently detects an excess:
Williams %R indicator is overbought : over -20
Type : Neutral
Timeframe : 1 hour
Pivot points : price is over resistance 1
Type : Neutral
Timeframe : 1 hour
Pivot points : price is over resistance 1
Type : Neutral
Timeframe : Weekly
MACD crosses UP its Moving Average
Type : Bullish
Timeframe : 1 hour
Aroon indicator bullish trend
Type : Bullish
Timeframe : 1 hour
An analysis of the price chart with the Central Patterns scanner (detector of chart patterns and resistances and supports) shows a result that can have an impact on the price change:
Near resistance of channel
Type : Bearish
Timeframe : 1 hour
The Central Candlesticks scanner, specialised in Japanese candlesticks, did not identify any signals.
| S3 | S2 | S1 | Price | R1 | R2 | R3 | |
|---|---|---|---|---|---|---|---|
| ProTrendLines | 11.198 | 11.268 | 11.405 | 11.470 | 11.475 | 11.585 | 11.687 |
| Change (%) | -2.37% | -1.76% | -0.57% | - | +0.04% | +1.00% | +1.89% |
| Change | -0.272 | -0.202 | -0.065 | - | +0.005 | +0.115 | +0.217 |
| Level | Intermediate | Major | Intermediate | - | Minor | Intermediate | Intermediate |
Attention could also be paid to pivot points to set price objectives:
| Pivot points | S3 | S2 | S1 | PP | R1 | R2 | R3 |
|---|---|---|---|---|---|---|---|
| Standard | 11.163 | 11.237 | 11.283 | 11.357 | 11.403 | 11.477 | 11.523 |
| Camarilla | 11.297 | 11.308 | 11.319 | 11.330 | 11.341 | 11.352 | 11.363 |
| Woodie | 11.150 | 11.230 | 11.270 | 11.350 | 11.390 | 11.470 | 11.510 |
| Fibonacci | 11.237 | 11.283 | 11.311 | 11.357 | 11.403 | 11.431 | 11.477 |
| Pivot points | S3 | S2 | S1 | PP | R1 | R2 | R3 |
|---|---|---|---|---|---|---|---|
| Standard | 10.898 | 11.017 | 11.168 | 11.287 | 11.438 | 11.557 | 11.708 |
| Camarilla | 11.246 | 11.271 | 11.295 | 11.320 | 11.345 | 11.370 | 11.394 |
| Woodie | 10.915 | 11.025 | 11.185 | 11.295 | 11.455 | 11.565 | 11.725 |
| Fibonacci | 11.017 | 11.120 | 11.184 | 11.287 | 11.390 | 11.454 | 11.557 |
| Pivot points | S3 | S2 | S1 | PP | R1 | R2 | R3 |
|---|---|---|---|---|---|---|---|
| Standard | 10.188 | 10.594 | 10.952 | 11.358 | 11.716 | 12.122 | 12.480 |
| Camarilla | 11.100 | 11.170 | 11.240 | 11.310 | 11.380 | 11.450 | 11.520 |
| Woodie | 10.164 | 10.582 | 10.928 | 11.346 | 11.692 | 12.110 | 12.456 |
| Fibonacci | 10.594 | 10.886 | 11.066 | 11.358 | 11.650 | 11.830 | 12.122 |
Numerical data
The following are the details of the technical indicators and moving averages that were collected to generate this technical analysis:
| RSI (14): | 62.79 | |
| MACD (12,26,9): | 0.0200 | |
| Directional Movement: | 22.088 | |
| AROON (14): | 14.286 | |
| DEMA (21): | 11.404 | |
| Parabolic SAR (0,02-0,02-0,2): | 11.510 | |
| Elder Ray (13): | 0.075 | |
| Super Trend (3,10): | 11.302 | |
| Zig ZAG (10): | 11.475 | |
| VORTEX (21): | 1.0500 | |
| Stochastique (14,3,5): | 66.36 | |
| TEMA (21): | 11.408 | |
| Williams %R (14): | -5.88 | |
| Chande Momentum Oscillator (20): | 0.080 | |
| Repulse (5,40,3): | 0.7030 | |
| ROCnROLL: | 1 | |
| TRIX (15,9): | 0.0240 | |
| Courbe Coppock: | 0.68 |
| MA7: | 11.335 | |
| MA20: | 11.316 | |
| MA50: | 11.345 | |
| MA100: | 10.588 | |
| MAexp7: | 11.400 | |
| MAexp20: | 11.377 | |
| MAexp50: | 11.343 | |
| MAexp100: | 11.330 | |
| Price / MA7: | +1.19% | |
| Price / MA20: | +1.36% | |
| Price / MA50: | +1.10% | |
| Price / MA100: | +8.33% | |
| Price / MAexp7: | +0.61% | |
| Price / MAexp20: | +0.82% | |
| Price / MAexp50: | +1.12% | |
| Price / MAexp100: | +1.24% |
News
The last news published on E.ON SE NA O.N. at the time of the generation of this analysis was as follows:
- EQS-News: E.ON SE:
- EQS-News: E.ON SE: E.ON begins the new financial year successfully and reaffirms investments in the energy transition
- EQS-News: E.ON SE: E.ON plans to increase investments in the energy transition following good full-year results
- NIKOLA AND E.ON SIGN COLLABORATION AGREEMENT WITH RICHTER GROUP TO DECARBONIZE THEIR HEAVY-DUTY FLEET IN GERMANY
- EQS-Adhoc: E.ON SE: Preliminary financial results for the financial year 2022