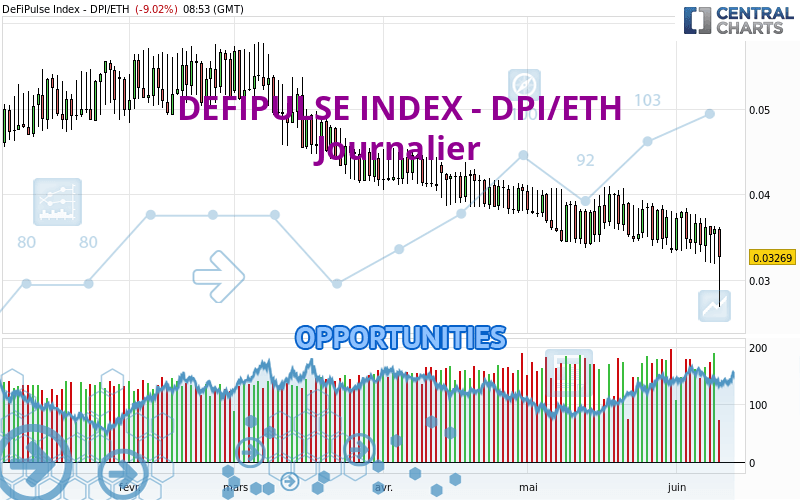
Londinia Opportunities Analyses - 06/10/2023 (GMT) DEFIPULSE INDEX - DPI/ETH - Daily
| Type: | Cryptocurrencies |
| Ticker: | DPIETH |
| ISIN: |
- Cryptocurrencies
- Timeframe : Daily
- - Analysis generated on
- Status : INVALID
Summary of the analysis
Trends
Short term:
Strongly bearish
Underlying:
Strongly bearish
Technical indicators
22%
61%
17%
My opinion
Bearish under 0.033440 ETH
My targets
0.030663 ETH (-5.83%)
0.027887 ETH (-14.35%)
My analysis
All elements being clearly bearish, it would be possible for traders to trade only short positions (for sale) on DEFIPULSE INDEX - DPI/ETH as long as the price remains well below 0.033440 ETH. The sellers' bearish objective is set at 0.030663 ETH. A bearish break of this support would revive the bearish momentum. The sellers could then target the support located at 0.027887 ETH. In case of crossing, the next objective would be the support located at 0.022713 ETH. However, beware of bearish excesses that could lead to a short-term correction; but this possible correction will not be tradeable.
Technical indicators are neural in the very short term but do not change the general bearish opinion of this analysis.
Force
0
10
7.3

Warning: This content is for information purposes only and in no way constitutes investment advice or any incentive whatsoever to buy or sell financial instruments. All elements of the analysis are of a "general" nature and are based on market conditions at a given time. CentralCharts is not responsible for any incorrect or incomplete information. Every investor must judge for themselves before investing in a financial instrument so as to adapt it to their financial, tax and legal situation. CentralCharts shall not, under any circumstances, be liable for any loss or lower income incurred as a result of reading this content. Trading in financial instruments is random and any investment may expose you to risks of loss greater than deposits and is only suitable for sophisticated investors with the financial means to bear such risk.
Additional analysis
Quotes
The DEFIPULSE INDEX - DPI/ETH rating is 0.032560 ETH. On the day, this instrument lost -9.38% with the lowest point at 0.026790 ETH and the highest point at 0.036140 ETH. The deviation from the price is +21.54% for the low point and -9.91% for the high point.0.026790
0.036140
0.032560
A study of price movements over other periods shows the following variations:
New LOW record (1 year)
Type : Bearish
Timeframe : Weekly
New LOW record (1st january)
Type : Bearish
Timeframe : Weekly
New LOW record (1 month)
Type : Bearish
Timeframe : Weekly
Technical
A technical analysis in Journalier of this DEFIPULSE INDEX - DPI/ETH chart shows a sharp bearish trend. 92.86% of the signals given by moving averages are bearish. This strongly bearish trend is supported by the strong bearish signals given by short-term moving averages. The Central Indicators scanner does not detect any result on moving averages that would impact this trend.
The technical indicators are generally neutral. They do not provide relevant information on the direction of future price movements.
But beware of excesses. The Central Indicators scanner currently detects this:
CCI indicator is oversold : under -100
Type : Neutral
Timeframe : Daily
Pivot points : price is under support 1
Type : Neutral
Timeframe : Daily
MACD crosses DOWN its Moving Average
Type : Bearish
Timeframe : Daily
Williams %R indicator is back under -50
Type : Bearish
Timeframe : Daily
The analysis of the price chart with Central Patterns scanners does not return any result.
The Central Candlesticks scanner, specialised in Japanese candlesticks, did not identify any signals.
ProTrendLines
R1
R2
R3
Price
| Price | R1 | R2 | R3 | |
|---|---|---|---|---|
| ProTrendLines | 0.032560 | 0.033440 | 0.040036 | 0.045969 |
| Change (%) | - | +2.70% | +22.96% | +41.18% |
| Change | - | +0.000880 | +0.007476 | +0.013409 |
| Level | - | Major | Minor | Intermediate |
Pivot points can also be used to set your price objectives. Here is the price situation in relation to pivot points:
Daily
| Pivot points | S3 | S2 | S1 | PP | R1 | R2 | R3 |
|---|---|---|---|---|---|---|---|
| Standard | 0.028627 | 0.030203 | 0.033067 | 0.034643 | 0.037507 | 0.039083 | 0.041947 |
| Camarilla | 0.034709 | 0.035116 | 0.035523 | 0.035930 | 0.036337 | 0.036744 | 0.037151 |
| Woodie | 0.029270 | 0.030525 | 0.033710 | 0.034965 | 0.038150 | 0.039405 | 0.042590 |
| Fibonacci | 0.030203 | 0.031899 | 0.032947 | 0.034643 | 0.036339 | 0.037387 | 0.039083 |
Weekly
| Pivot points | S3 | S2 | S1 | PP | R1 | R2 | R3 |
|---|---|---|---|---|---|---|---|
| Standard | 0.026620 | 0.029840 | 0.032320 | 0.035540 | 0.038020 | 0.041240 | 0.043720 |
| Camarilla | 0.033233 | 0.033755 | 0.034278 | 0.034800 | 0.035323 | 0.035845 | 0.036368 |
| Woodie | 0.026250 | 0.029655 | 0.031950 | 0.035355 | 0.037650 | 0.041055 | 0.043350 |
| Fibonacci | 0.029840 | 0.032017 | 0.033363 | 0.035540 | 0.037717 | 0.039063 | 0.041240 |
Monthly
| Pivot points | S3 | S2 | S1 | PP | R1 | R2 | R3 |
|---|---|---|---|---|---|---|---|
| Standard | 0.022713 | 0.027887 | 0.030663 | 0.035837 | 0.038613 | 0.043787 | 0.046563 |
| Camarilla | 0.031254 | 0.031983 | 0.032711 | 0.033440 | 0.034169 | 0.034898 | 0.035626 |
| Woodie | 0.021515 | 0.027288 | 0.029465 | 0.035238 | 0.037415 | 0.043188 | 0.045365 |
| Fibonacci | 0.027887 | 0.030924 | 0.032800 | 0.035837 | 0.038874 | 0.040750 | 0.043787 |
Numerical data
The following is the status of technical indicators and moving averages registered at the time this technical analysis was created:
Technical indicators
Moving averages
| RSI (14): | 43.86 | |
| MACD (12,26,9): | -0.0008 | |
| Directional Movement: | -10.740617 | |
| AROON (14): | -100.000000 | |
| DEMA (21): | 0.034760 | |
| Parabolic SAR (0,02-0,02-0,2): | 0.037114 | |
| Elder Ray (13): | -0.003916 | |
| Super Trend (3,10): | 0.046445 | |
| Zig ZAG (10): | 0.032650 | |
| VORTEX (21): | 0.9089 | |
| Stochastique (14,3,5): | 51.38 | |
| TEMA (21): | 0.034728 | |
| Williams %R (14): | -51.04 | |
| Chande Momentum Oscillator (20): | -0.002110 | |
| Repulse (5,40,3): | 6.3487 | |
| ROCnROLL: | 2 | |
| TRIX (15,9): | -0.2454 | |
| Courbe Coppock: | 8.27 |
| MA7: | 0.034981 | |
| MA20: | 0.035762 | |
| MA50: | 0.037149 | |
| MA100: | 0.041205 | |
| MAexp7: | 0.034866 | |
| MAexp20: | 0.035786 | |
| MAexp50: | 0.037569 | |
| MAexp100: | 0.040795 | |
| Price / MA7: | -6.92% | |
| Price / MA20: | -8.95% | |
| Price / MA50: | -12.35% | |
| Price / MA100: | -20.98% | |
| Price / MAexp7: | -6.61% | |
| Price / MAexp20: | -9.01% | |
| Price / MAexp50: | -13.33% | |
| Price / MAexp100: | -20.19% |
Quotes :
-
Real time data
-
Cryptocompare