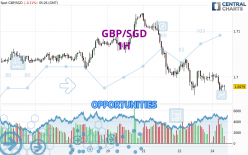
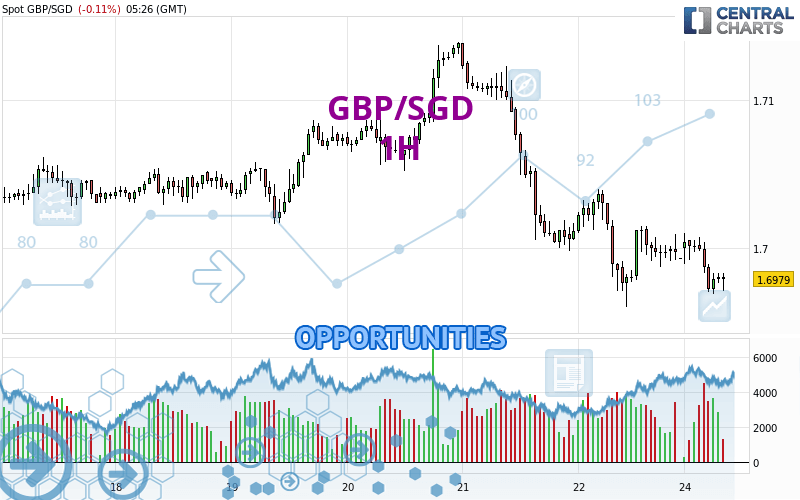
Londinia Opportunities Analyses - 03/25/2024 (GMT) GBP/SGD - 1H
I am pleased to note that the threshold for invalidation has been maintained for 20 Candlesticks.
- FX/Indices
- Timeframe : 1H
- - Analysis generated on
- Status : LEVEL MAINTAINED
Summary of the analysis
Trends
Short term:
Strongly bearish
Underlying:
Strongly bearish
Technical indicators
11%
67%
22%
My opinion
Bearish under 1.7027 SGD
My targets
1.6886 SGD (-0.0095)
1.6743 SGD (-0.0238)
My analysis
All elements being clearly bearish, it would be possible for traders to trade only short positions (for sale) on GBP/SGD as long as the price remains well below 1.7027 SGD. The sellers' bearish objective is set at 1.6886 SGD. A bearish break of this support would revive the bearish momentum. The sellers could then target the support located at 1.6743 SGD. In case of crossing, the next objective would be the support located at 1.6674 SGD. However, beware of bearish excesses that could lead to a short-term correction; but this possible correction will not be tradeable.
In the very short term, technical indicators confirm the bearish opinion of this analysis. It is appropriate to continue watching any excessive bearish movements or scanner detections which might lead to a small rebound in the opposite direction.
Force
0
10
7.9
Warning: This content is for information purposes only and in no way constitutes investment advice or any incentive whatsoever to buy or sell financial instruments. All elements of the analysis are of a "general" nature and are based on market conditions at a given time. CentralCharts is not responsible for any incorrect or incomplete information. Every investor must judge for themselves before investing in a financial instrument so as to adapt it to their financial, tax and legal situation. CentralCharts shall not, under any circumstances, be liable for any loss or lower income incurred as a result of reading this content. Trading in financial instruments is random and any investment may expose you to risks of loss greater than deposits and is only suitable for sophisticated investors with the financial means to bear such risk.
Additional analysis
Quotes
GBP/SGD rating 1.6981 SGD. On the day, this instrument lost -0.09% with the lowest point at 1.6969 SGD and the highest point at 1.7010 SGD. The deviation from the price is +0.07% for the low point and -0.17% for the high point.1.6969
1.7010
1.6981
A bullish opening was detected by the Central Gaps scanner. Buyers are trying to impose a bullish momentum in the very short term.
Bullish opening
Type : Bullish
Timeframe : Openning
So that you have an overall view of the price change, here is a table showing the variations over several periods:
Near a new LOW record (1 year)
Type : Bearish
Timeframe : Weekly
Near a new LOW record (1st january)
Type : Bearish
Timeframe : Weekly
Near a new HIGH record (1 month)
Type : Bullish
Timeframe : Weekly
Technical
Technical analysis of GBP/SGD in 1H shows a overall strongly bearish trend. 92.86% of the signals given by moving averages are bearish. This strongly bearish trend is supported by the strong bearish signals given by short-term moving averages. The Central Indicators scanner does not detect any result on moving averages that would impact this trend.
In fact, 12 technical indicators on 18 studied are currently bearish. But beware of excesses. The Central Indicators scanner currently detects this:
CCI indicator is oversold : under -100
Type : Neutral
Timeframe : 1 hour
Williams %R indicator is oversold : under -80
Type : Neutral
Timeframe : 1 hour
An analysis of the price chart with the Central Patterns scanner (detector of chart patterns and resistances and supports) shows a result that can have an impact on the price change:
Near horizontal support
Type : Bullish
Timeframe : 1 hour
The Central Candlesticks scanner which studies Japanese candlesticks did not detect anything.
ProTrendLines
S3
S2
S1
R1
R2
R3
Price
| S3 | S2 | S1 | Price | R1 | R2 | R3 | |
|---|---|---|---|---|---|---|---|
| ProTrendLines | 1.6743 | 1.6886 | 1.6965 | 1.6981 | 1.7027 | 1.7052 | 1.7082 |
| Change (%) | -1.40% | -0.56% | -0.09% | - | +0.27% | +0.42% | +0.59% |
| Change | -0.0238 | -0.0095 | -0.0016 | - | +0.0046 | +0.0071 | +0.0101 |
| Level | Intermediate | Intermediate | Intermediate | - | Major | Minor | Minor |
Pivot points can also be used to set your price objectives. Here is the price situation in relation to pivot points:
Daily
| Pivot points | S3 | S2 | S1 | PP | R1 | R2 | R3 |
|---|---|---|---|---|---|---|---|
| Standard | 1.6875 | 1.6918 | 1.6955 | 1.6998 | 1.7035 | 1.7078 | 1.7115 |
| Camarilla | 1.6971 | 1.6978 | 1.6986 | 1.6993 | 1.7000 | 1.7008 | 1.7015 |
| Woodie | 1.6873 | 1.6917 | 1.6953 | 1.6997 | 1.7033 | 1.7077 | 1.7113 |
| Fibonacci | 1.6918 | 1.6948 | 1.6967 | 1.6998 | 1.7028 | 1.7047 | 1.7078 |
Weekly
| Pivot points | S3 | S2 | S1 | PP | R1 | R2 | R3 |
|---|---|---|---|---|---|---|---|
| Standard | 1.6743 | 1.6852 | 1.6922 | 1.7031 | 1.7101 | 1.7210 | 1.7280 |
| Camarilla | 1.6944 | 1.6960 | 1.6977 | 1.6993 | 1.7009 | 1.7026 | 1.7042 |
| Woodie | 1.6725 | 1.6842 | 1.6904 | 1.7021 | 1.7083 | 1.7200 | 1.7262 |
| Fibonacci | 1.6852 | 1.6920 | 1.6962 | 1.7031 | 1.7099 | 1.7141 | 1.7210 |
Monthly
| Pivot points | S3 | S2 | S1 | PP | R1 | R2 | R3 |
|---|---|---|---|---|---|---|---|
| Standard | 1.6699 | 1.6787 | 1.6890 | 1.6978 | 1.7081 | 1.7169 | 1.7272 |
| Camarilla | 1.6941 | 1.6958 | 1.6976 | 1.6993 | 1.7011 | 1.7028 | 1.7046 |
| Woodie | 1.6707 | 1.6791 | 1.6898 | 1.6982 | 1.7089 | 1.7173 | 1.7280 |
| Fibonacci | 1.6787 | 1.6860 | 1.6905 | 1.6978 | 1.7051 | 1.7096 | 1.7169 |
Numerical data
The following are the details of the technical indicators and moving averages that were collected to generate this technical analysis:
Technical indicators
Moving averages
| RSI (14): | 34.38 | |
| MACD (12,26,9): | -0.0011 | |
| Directional Movement: | -11.3409 | |
| AROON (14): | -42.8572 | |
| DEMA (21): | 1.6979 | |
| Parabolic SAR (0,02-0,02-0,2): | 1.7006 | |
| Elder Ray (13): | -0.0012 | |
| Super Trend (3,10): | 1.7019 | |
| Zig ZAG (10): | 1.6974 | |
| VORTEX (21): | 0.9870 | |
| Stochastique (14,3,5): | 21.95 | |
| TEMA (21): | 1.6981 | |
| Williams %R (14): | -80.49 | |
| Chande Momentum Oscillator (20): | -0.0022 | |
| Repulse (5,40,3): | -0.0649 | |
| ROCnROLL: | 2 | |
| TRIX (15,9): | -0.0083 | |
| Courbe Coppock: | 0.16 |
| MA7: | 1.7039 | |
| MA20: | 1.7045 | |
| MA50: | 1.7016 | |
| MA100: | 1.6926 | |
| MAexp7: | 1.6984 | |
| MAexp20: | 1.6993 | |
| MAexp50: | 1.7015 | |
| MAexp100: | 1.7033 | |
| Price / MA7: | -0.34% | |
| Price / MA20: | -0.38% | |
| Price / MA50: | -0.21% | |
| Price / MA100: | +0.32% | |
| Price / MAexp7: | -0.02% | |
| Price / MAexp20: | -0.07% | |
| Price / MAexp50: | -0.20% | |
| Price / MAexp100: | -0.31% |
Quotes :
-
Real time data
-
Forex