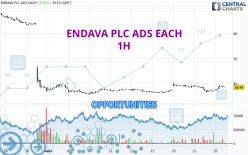
Londinia Opportunities Analyses - 03/25/2024 (GMT) ENDAVA PLC ADS EACH - 1H
- U.S. Stocks
- Timeframe : 1H
- - Analysis generated on
- Status : INVALID
Summary of the analysis
Trends
Short term:
Bullish
Underlying:
Bullish
Technical indicators
72%
6%
22%
My opinion
Bullish above 37.95 USD
My targets
39.89 USD (+3.66%)
40.65 USD (+5.64%)
My analysis
A bullish trend on ENDAVA PLC ADS EACH both in substance and in the short term. A purchase could be considered as long as the price remains above 37.95 USD. Each resistance break is a strong signal that the current trend will continue. The first bullish objective would be 39.89 USD. Then the price could move towards 40.65 USD. Then 45.52 USD by extension. Be careful, a return below 37.95 USD would be a sign of the trend weakening and a possible correction phase could then occur. In this case, you could keep away while waiting for a signal that the basic trend will resume. Trading against the trend could be riskier.
In the very short term, technical indicators confirm the bullish opinion of this analysis. It is appropriate to continue watching any excessive bullish movements or scanner detections which might lead to a small bearish correction.
Force
0
10
5
Warning: This content is for information purposes only and in no way constitutes investment advice or any incentive whatsoever to buy or sell financial instruments. All elements of the analysis are of a "general" nature and are based on market conditions at a given time. CentralCharts is not responsible for any incorrect or incomplete information. Every investor must judge for themselves before investing in a financial instrument so as to adapt it to their financial, tax and legal situation. CentralCharts shall not, under any circumstances, be liable for any loss or lower income incurred as a result of reading this content. Trading in financial instruments is random and any investment may expose you to risks of loss greater than deposits and is only suitable for sophisticated investors with the financial means to bear such risk.
Additional analysis
Quotes
The ENDAVA PLC ADS EACH price is 38.48 USD. On the day, this instrument gained +3.47% and was between 37.25 USD and 39.19 USD. This implies that the price is at +3.30% from its lowest and at -1.81% from its highest.37.25
39.19
38.48
The Central Gaps scanner detects a bullish opening. A small advantage for buyers in the very short term.
Bullish opening
Type : Bullish
Timeframe : Openning
Here is a more detailed summary of the historical variations registered by ENDAVA PLC ADS EACH:
Abnormal volumes
Timeframe : 5 days
Abnormal volumes
Timeframe : 20 days
Technical
A technical analysis in 1H of this ENDAVA PLC ADS EACH chart shows a bullish trend. The signals given by moving averages are 64.29% bullish. This bullish trend is slowing down slightly given the slightly bullish signals of short-term moving averages. The Central Indicators scanner detects a bearish signal on moving averages that could impact this trend:
Bearish trend reversal : Moving Average 20
Type : Bearish
Timeframe : 1 hour
The probability of a further increase is high given the direction of the technical indicators.
Caution: the Central Indicators scanner currently detects an excess:
Williams %R indicator is overbought : over -20
Type : Neutral
Timeframe : 1 hour
Pivot points : price is over resistance 1
Type : Neutral
Timeframe : 1 hour
Price is back over the pivot point
Type : Bullish
Timeframe : Weekly
No signals are given by Central Patterns, a market scanner specialised in chart patterns, resistances and supports.
The Central Candlesticks scanner which studies Japanese candlesticks did not detect anything.
ProTrendLines
S1
R1
R2
R3
Price
| S1 | Price | R1 | R2 | R3 | |
|---|---|---|---|---|---|
| ProTrendLines | 36.09 | 38.48 | 40.65 | 45.52 | 60.28 |
| Change (%) | -6.21% | - | +5.64% | +18.30% | +56.65% |
| Change | -2.39 | - | +2.17 | +7.04 | +21.80 |
| Level | Major | - | Minor | Intermediate | Major |
Attention could also be paid to pivot points to set price objectives:
Daily
| Pivot points | S3 | S2 | S1 | PP | R1 | R2 | R3 |
|---|---|---|---|---|---|---|---|
| Standard | 34.72 | 35.52 | 36.36 | 37.16 | 38.00 | 38.80 | 39.64 |
| Camarilla | 36.74 | 36.89 | 37.04 | 37.19 | 37.34 | 37.49 | 37.64 |
| Woodie | 34.73 | 35.53 | 36.37 | 37.17 | 38.01 | 38.81 | 39.65 |
| Fibonacci | 35.52 | 36.15 | 36.54 | 37.16 | 37.79 | 38.18 | 38.80 |
Weekly
| Pivot points | S3 | S2 | S1 | PP | R1 | R2 | R3 |
|---|---|---|---|---|---|---|---|
| Standard | 30.61 | 33.31 | 35.25 | 37.95 | 39.89 | 42.59 | 44.53 |
| Camarilla | 35.91 | 36.34 | 36.77 | 37.19 | 37.62 | 38.04 | 38.47 |
| Woodie | 30.23 | 33.12 | 34.87 | 37.76 | 39.51 | 42.40 | 44.15 |
| Fibonacci | 33.31 | 35.08 | 36.18 | 37.95 | 39.72 | 40.82 | 42.59 |
Monthly
| Pivot points | S3 | S2 | S1 | PP | R1 | R2 | R3 |
|---|---|---|---|---|---|---|---|
| Standard | -11.91 | 12.23 | 24.70 | 48.84 | 61.31 | 85.45 | 97.92 |
| Camarilla | 27.10 | 30.46 | 33.81 | 37.17 | 40.53 | 43.88 | 47.24 |
| Woodie | -17.75 | 9.31 | 18.87 | 45.92 | 55.48 | 82.53 | 92.09 |
| Fibonacci | 12.23 | 26.22 | 34.86 | 48.84 | 62.83 | 71.47 | 85.45 |
Numerical data
The following is the status of the technical indicators and moving averages at the time of publication of this technical analysis:
Technical indicators
Moving averages
| RSI (14): | 56.32 | |
| MACD (12,26,9): | 0.1100 | |
| Directional Movement: | 11.51 | |
| AROON (14): | 64.28 | |
| DEMA (21): | 38.14 | |
| Parabolic SAR (0,02-0,02-0,2): | 36.94 | |
| Elder Ray (13): | 0.58 | |
| Super Trend (3,10): | 37.13 | |
| Zig ZAG (10): | 38.62 | |
| VORTEX (21): | 0.9900 | |
| Stochastique (14,3,5): | 90.85 | |
| TEMA (21): | 38.20 | |
| Williams %R (14): | -17.66 | |
| Chande Momentum Oscillator (20): | 1.69 | |
| Repulse (5,40,3): | 1.3300 | |
| ROCnROLL: | 1 | |
| TRIX (15,9): | -0.0300 | |
| Courbe Coppock: | 0.24 |
| MA7: | 37.88 | |
| MA20: | 40.20 | |
| MA50: | 59.07 | |
| MA100: | 62.83 | |
| MAexp7: | 38.34 | |
| MAexp20: | 38.05 | |
| MAexp50: | 38.08 | |
| MAexp100: | 40.14 | |
| Price / MA7: | +1.58% | |
| Price / MA20: | -4.28% | |
| Price / MA50: | -34.86% | |
| Price / MA100: | -38.76% | |
| Price / MAexp7: | +0.37% | |
| Price / MAexp20: | +1.13% | |
| Price / MAexp50: | +1.05% | |
| Price / MAexp100: | -4.14% |
Quotes :
-
15 min delayed data
-
Actions NYSE