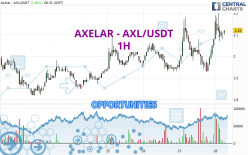
Londinia Opportunities Analyses - 03/28/2024 (GMT) AXELAR - AXL/USDT - 1H
| Type: | Cryptocurrencies |
| Ticker: | AXLUSDT |
| ISIN: |
- Cryptocurrencies
- Timeframe : 1H
- - Analysis generated on
- Status : INVALID
Summary of the analysis
Trends
Short term:
Strongly bullish
Underlying:
Strongly bullish
Technical indicators
83%
0%
17%
My opinion
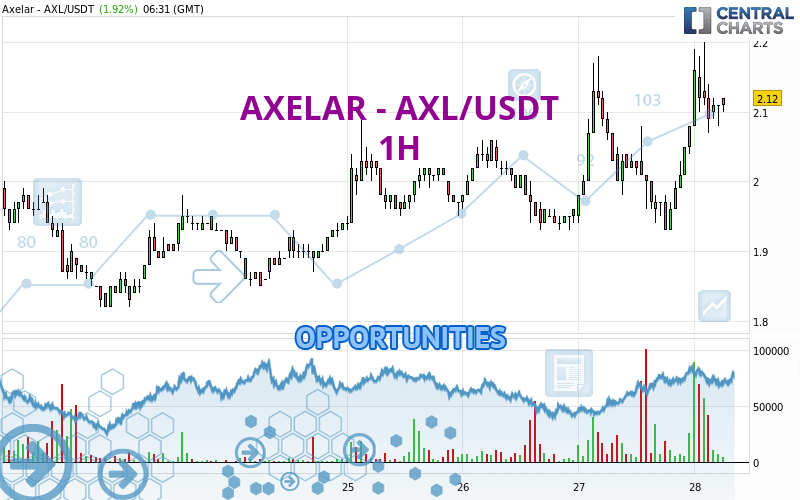
Bullish above 2.09 USDT
My targets
2.18 USDT (+2.83%)
2.31 USDT (+8.96%)
My analysis
The bullish trend is currently very strong on AXELAR - AXL/USDT. As long as the price remains above the support at 2.09 USDT, you could try to benefit from the boom. The first bullish objective is located at 2.18 USDT. The bullish momentum would be boosted by a break in this resistance. Buyers would then use the next resistance located at 2.31 USDT as an objective. Crossing it would then enable buyers to target 2.37 USDT. Be careful, given the powerful bullish rally underway, excesses could lead to a possible correction in the short term. If this is the case, remember that trading against the trend may be riskier. It would seem more appropriate to wait for a signal indicating reversal of the trend.
In the very short term, the general bullish sentiment is confirmed by technical indicators. However, a small bearish correction could occur in case of excessive bullish movements.
Force
0
10
8.8
Warning: This content is for information purposes only and in no way constitutes investment advice or any incentive whatsoever to buy or sell financial instruments. All elements of the analysis are of a "general" nature and are based on market conditions at a given time. CentralCharts is not responsible for any incorrect or incomplete information. Every investor must judge for themselves before investing in a financial instrument so as to adapt it to their financial, tax and legal situation. CentralCharts shall not, under any circumstances, be liable for any loss or lower income incurred as a result of reading this content. Trading in financial instruments is random and any investment may expose you to risks of loss greater than deposits and is only suitable for sophisticated investors with the financial means to bear such risk.
Additional analysis
Quotes
AXELAR - AXL/USDT rating 2.12 USDT. The price has increased by +1.92% since the last closing and was traded between 2.07 USDT and 2.20 USDT over the period. The price is currently at +2.42% from its lowest and -3.64% from its highest.2.07
2.20
2.12
The Central Gaps scanner detects a bullish opening. A small advantage for buyers in the very short term.
Bullish opening
Type : Bullish
Timeframe : Openning
Here is a more detailed summary of the historical variations registered by AXELAR - AXL/USDT:
Technical
Technical analysis of AXELAR - AXL/USDT in 1H shows a strongly overall bullish trend. 92.86% of the signals given by moving averages are bullish. The overall trend is supported by the strong bullish signals from short-term moving averages. There is no crossing of moving average by the price or crossing of moving averages between themselves.
An assessment of technical indicators shows a strong bullish signal.
Central Indicators, the detector scanner for these technical indicators recently detected a signal:
Price is back over the pivot point
Type : Bullish
Timeframe : Weekly
Central Patterns, the scanner specializing in chart patterns, did not identify any signals.
Central Candlesticks, the scanner specialised in Japanese candlesticks, detects a bullish signal that could support the hypothesis of a small rebound in the very short term:
Bullish engulfing lines
Type : Bullish
Timeframe : 1 hour
ProTrendLines
S3
S2
S1
R1
R2
R3
Price
| S3 | S2 | S1 | Price | R1 | R2 | R3 | |
|---|---|---|---|---|---|---|---|
| ProTrendLines | 1.93 | 2.00 | 2.09 | 2.12 | 2.18 | 2.31 | 2.37 |
| Change (%) | -8.96% | -5.66% | -1.42% | - | +2.83% | +8.96% | +11.79% |
| Change | -0.19 | -0.12 | -0.03 | - | +0.06 | +0.19 | +0.25 |
| Level | Major | Minor | Intermediate | - | Minor | Intermediate | Major |
Attention could also be paid to pivot points to set price objectives:
Daily
| Pivot points | S3 | S2 | S1 | PP | R1 | R2 | R3 |
|---|---|---|---|---|---|---|---|
| Standard | 1.70 | 1.81 | 1.95 | 2.06 | 2.20 | 2.31 | 2.45 |
| Camarilla | 2.01 | 2.03 | 2.06 | 2.08 | 2.10 | 2.13 | 2.15 |
| Woodie | 1.71 | 1.82 | 1.96 | 2.07 | 2.21 | 2.32 | 2.46 |
| Fibonacci | 1.81 | 1.91 | 1.97 | 2.06 | 2.16 | 2.22 | 2.31 |
Weekly
| Pivot points | S3 | S2 | S1 | PP | R1 | R2 | R3 |
|---|---|---|---|---|---|---|---|
| Standard | 0.79 | 1.18 | 1.54 | 1.93 | 2.29 | 2.68 | 3.04 |
| Camarilla | 1.70 | 1.77 | 1.84 | 1.91 | 1.98 | 2.05 | 2.12 |
| Woodie | 0.79 | 1.17 | 1.54 | 1.92 | 2.29 | 2.67 | 3.04 |
| Fibonacci | 1.18 | 1.46 | 1.64 | 1.93 | 2.21 | 2.39 | 2.68 |
Monthly
| Pivot points | S3 | S2 | S1 | PP | R1 | R2 | R3 |
|---|---|---|---|---|---|---|---|
| Standard | 0.49 | 0.73 | 1.12 | 1.36 | 1.75 | 1.99 | 2.38 |
| Camarilla | 1.34 | 1.40 | 1.45 | 1.51 | 1.57 | 1.63 | 1.68 |
| Woodie | 0.57 | 0.77 | 1.20 | 1.40 | 1.83 | 2.03 | 2.46 |
| Fibonacci | 0.73 | 0.97 | 1.12 | 1.36 | 1.60 | 1.75 | 1.99 |
Numerical data
The following is the status of the technical indicators and moving averages at the time of publication of this technical analysis:
Technical indicators
Moving averages
| RSI (14): | 61.66 | |
| MACD (12,26,9): | 0.0300 | |
| Directional Movement: | 13.03 | |
| AROON (14): | 57.14 | |
| DEMA (21): | 2.10 | |
| Parabolic SAR (0,02-0,02-0,2): | 2.03 | |
| Elder Ray (13): | 0.03 | |
| Super Trend (3,10): | 1.99 | |
| Zig ZAG (10): | 2.11 | |
| VORTEX (21): | 1.1100 | |
| Stochastique (14,3,5): | 66.43 | |
| TEMA (21): | 2.12 | |
| Williams %R (14): | -33.15 | |
| Chande Momentum Oscillator (20): | 0.18 | |
| Repulse (5,40,3): | 1.2100 | |
| ROCnROLL: | 1 | |
| TRIX (15,9): | 0.1400 | |
| Courbe Coppock: | 12.54 |
| MA7: | 1.97 | |
| MA20: | 2.00 | |
| MA50: | 1.71 | |
| MA100: | 1.37 | |
| MAexp7: | 2.10 | |
| MAexp20: | 2.06 | |
| MAexp50: | 2.03 | |
| MAexp100: | 1.99 | |
| Price / MA7: | +7.61% | |
| Price / MA20: | +6.00% | |
| Price / MA50: | +23.98% | |
| Price / MA100: | +54.74% | |
| Price / MAexp7: | +0.95% | |
| Price / MAexp20: | +2.91% | |
| Price / MAexp50: | +4.43% | |
| Price / MAexp100: | +6.53% |
Quotes :
-
Real time data
-
Cryptocompare