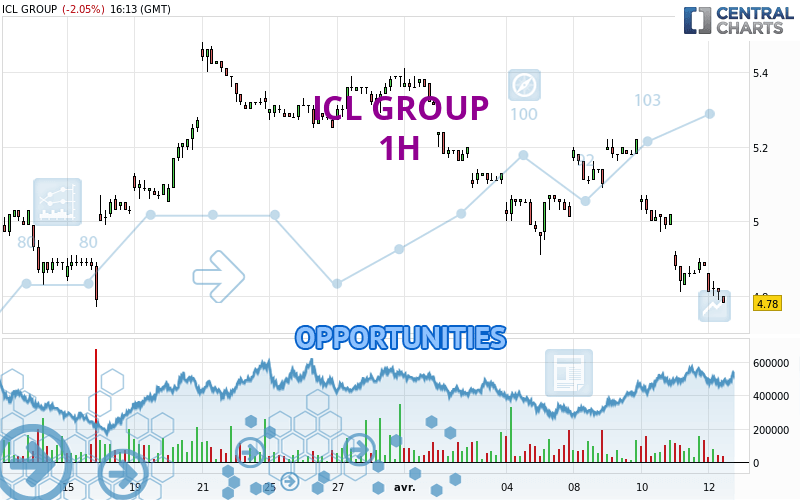
Londinia Opportunities Analyses - 04/12/2024 (GMT) ICL GROUP - 1H
-
USD
(-)
-
15 min delayed data - NYSE Stocks
| Type: | Stocks |
| Ticker: | ICL |
| ISIN: | IL0002810146 |
I am delighted to see that my first price objective has been achieved. I hope you've taken advantage of it.
- U.S. Stocks
- Timeframe : 1H
- - Analysis generated on
- Status : TARGET REACHED
Summary of the analysis
Trends
Short term:
Strongly bearish
Underlying:
Strongly bearish
Technical indicators
11%
83%
6%
My opinion
Bearish under 4.83 USD
My targets
4.77 USD (-0.63%)
4.65 USD (-3.13%)
My analysis
ICL GROUP is part of a very strong bearish trend. Traders may consider trading only short positions (for sale) as long as the price remains well below 4.83 USD. The next support located at 4.77 USD is the next bearish objective to target. A bearish break of this support would revive the bearish momentum. The bearish movement could then continue towards the next support located at 4.65 USD. Below this support, sellers could then target 4.34 USD. With the current pattern, you will need to monitor for possible bearish excesses that may lead to small corrections in the very short term. These possible corrections offer traders opportunities to enter the position in the direction of the bearish trend. Trying to profit from the purchase of these possible corrections may seem risky.
In the very short term, the general bearish sentiment is confirmed by technical indicators. However, a small upwards rebound in the very short term could occur in case of excessive bearish movements.
Force
0
10
8.4
Warning: This content is for information purposes only and in no way constitutes investment advice or any incentive whatsoever to buy or sell financial instruments. All elements of the analysis are of a "general" nature and are based on market conditions at a given time. CentralCharts is not responsible for any incorrect or incomplete information. Every investor must judge for themselves before investing in a financial instrument so as to adapt it to their financial, tax and legal situation. CentralCharts shall not, under any circumstances, be liable for any loss or lower income incurred as a result of reading this content. Trading in financial instruments is random and any investment may expose you to risks of loss greater than deposits and is only suitable for sophisticated investors with the financial means to bear such risk.
Additional analysis
Quotes
The ICL GROUP price is 4.80 USD. On the day, this instrument lost -1.64% and was traded between 4.79 USD and 4.86 USD over the period. The price is currently at +0.21% from its lowest and -1.23% from its highest.4.79
4.86
4.80
Here is a more detailed summary of the historical variations registered by ICL GROUP:
Near a new LOW record (1 month)
Type : Bearish
Timeframe : Weekly
Technical
A technical analysis in 1H of this ICL GROUP chart shows a sharp bearish trend. 92.86% of the signals given by moving averages are bearish. The overall trend is supported by the strong bearish signals from short-term moving averages. There is no crossing of moving average by the price or crossing of moving averages between themselves.
Technical indicators are strongly bearish, suggesting that the price decline is expected to continue.
But beware of excesses. The Central Indicators scanner currently detects this:
Williams %R indicator is oversold : under -80
Type : Neutral
Timeframe : 1 hour
Pivot points : price is under support 1
Type : Neutral
Timeframe : 1 hour
Pivot points : price is under support 1
Type : Neutral
Timeframe : Weekly
No signals are given by Central Patterns, a market scanner specialised in chart patterns, resistances and supports.
The Central Candlesticks scanner which studies Japanese candlesticks did not detect anything.
ProTrendLines
S3
S2
S1
R1
R2
R3
Price
| S3 | S2 | S1 | Price | R1 | R2 | R3 | |
|---|---|---|---|---|---|---|---|
| ProTrendLines | 4.34 | 4.65 | 4.77 | 4.80 | 4.83 | 4.91 | 5.23 |
| Change (%) | -9.58% | -3.13% | -0.63% | - | +0.63% | +2.29% | +8.96% |
| Change | -0.46 | -0.15 | -0.03 | - | +0.03 | +0.11 | +0.43 |
| Level | Minor | Intermediate | Intermediate | - | Minor | Minor | Major |
Attention could also be paid to pivot points to set price objectives:
Daily
| Pivot points | S3 | S2 | S1 | PP | R1 | R2 | R3 |
|---|---|---|---|---|---|---|---|
| Standard | 4.71 | 4.76 | 4.82 | 4.87 | 4.93 | 4.98 | 5.04 |
| Camarilla | 4.85 | 4.86 | 4.87 | 4.88 | 4.89 | 4.90 | 4.91 |
| Woodie | 4.72 | 4.76 | 4.83 | 4.87 | 4.94 | 4.98 | 5.05 |
| Fibonacci | 4.76 | 4.80 | 4.83 | 4.87 | 4.91 | 4.94 | 4.98 |
Weekly
| Pivot points | S3 | S2 | S1 | PP | R1 | R2 | R3 |
|---|---|---|---|---|---|---|---|
| Standard | 4.32 | 4.61 | 4.82 | 5.11 | 5.32 | 5.61 | 5.82 |
| Camarilla | 4.88 | 4.93 | 4.97 | 5.02 | 5.07 | 5.11 | 5.16 |
| Woodie | 4.27 | 4.59 | 4.77 | 5.09 | 5.27 | 5.59 | 5.77 |
| Fibonacci | 4.61 | 4.80 | 4.92 | 5.11 | 5.30 | 5.42 | 5.61 |
Monthly
| Pivot points | S3 | S2 | S1 | PP | R1 | R2 | R3 |
|---|---|---|---|---|---|---|---|
| Standard | 4.15 | 4.46 | 4.92 | 5.23 | 5.69 | 6.00 | 6.46 |
| Camarilla | 5.17 | 5.24 | 5.31 | 5.38 | 5.45 | 5.52 | 5.59 |
| Woodie | 4.23 | 4.50 | 5.00 | 5.27 | 5.77 | 6.04 | 6.54 |
| Fibonacci | 4.46 | 4.75 | 4.94 | 5.23 | 5.52 | 5.71 | 6.00 |
Numerical data
The following is the status of technical indicators and moving averages registered at the time this technical analysis was created:
Technical indicators
Moving averages
| RSI (14): | 30.25 | |
| MACD (12,26,9): | -0.0800 | |
| Directional Movement: | -29.00 | |
| AROON (14): | -92.86 | |
| DEMA (21): | 4.84 | |
| Parabolic SAR (0,02-0,02-0,2): | 4.92 | |
| Elder Ray (13): | -0.09 | |
| Super Trend (3,10): | 4.94 | |
| Zig ZAG (10): | 4.81 | |
| VORTEX (21): | 0.7400 | |
| Stochastique (14,3,5): | 4.26 | |
| TEMA (21): | 4.80 | |
| Williams %R (14): | -93.75 | |
| Chande Momentum Oscillator (20): | -0.20 | |
| Repulse (5,40,3): | -0.9500 | |
| ROCnROLL: | 2 | |
| TRIX (15,9): | -0.1800 | |
| Courbe Coppock: | 9.30 |
| MA7: | 5.00 | |
| MA20: | 5.15 | |
| MA50: | 5.04 | |
| MA100: | 4.97 | |
| MAexp7: | 4.84 | |
| MAexp20: | 4.93 | |
| MAexp50: | 5.03 | |
| MAexp100: | 5.10 | |
| Price / MA7: | -4.00% | |
| Price / MA20: | -6.80% | |
| Price / MA50: | -4.76% | |
| Price / MA100: | -3.42% | |
| Price / MAexp7: | -0.83% | |
| Price / MAexp20: | -2.64% | |
| Price / MAexp50: | -4.57% | |
| Price / MAexp100: | -5.88% |
Quotes :
-
15 min delayed data
-
Actions NYSE
News
Don't forget to follow the news on ICL GROUP. At the time of publication of this analysis, the latest news was as follows:
- ICL Breaks Ground on $400 Million Battery Materials Manufacturing Plant in St. Louis
- ICL Reports Second Quarter 2023 Results
- ICL Announces Second Quarter 2023 Earnings Call
- ICL Provides Updates on Chinese Potash Agreement and 2023 EBITDA Guidance
- ICL Publishes Annual Corporate Responsibility (ESG) Report