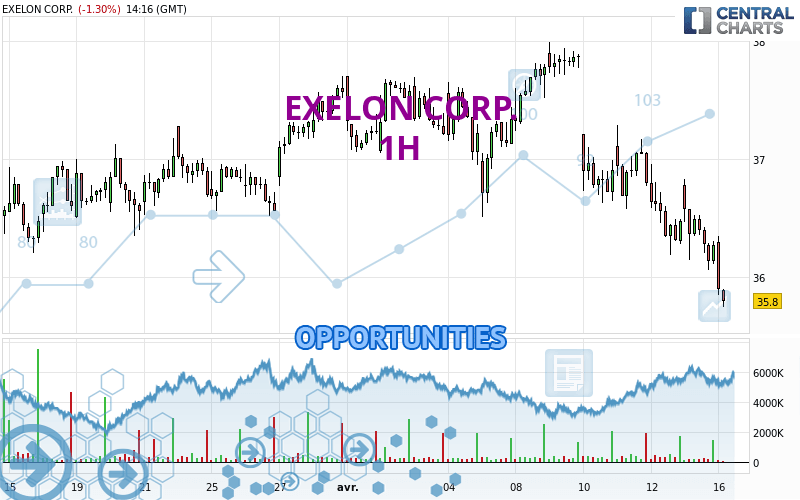
Londinia Opportunities Analyses - 04/16/2024 (GMT) EXELON CORP. - 1H
- U.S. Stocks
- Timeframe : 1H
- - Analysis generated on
- Status : INVALID
Summary of the analysis
Trends
Short term:
Strongly bearish
Underlying:
Strongly bearish
Technical indicators
11%
78%
11%
My opinion
Bearish under 36.20 USD
My targets
34.92 USD (-2.49%)
33.62 USD (-6.12%)
My analysis
All elements being clearly bearish, it would be possible for traders to trade only short positions (for sale) on EXELON CORP. as long as the price remains well below 36.20 USD. The sellers' bearish objective is set at 34.92 USD. A bearish break of this support would revive the bearish momentum. The sellers could then target the support located at 33.62 USD. In case of crossing, the next objective would be the support located at 31.32 USD. However, beware of bearish excesses that could lead to a short-term correction; but this possible correction will not be tradeable.
In the very short term, the general bearish sentiment is confirmed by technical indicators. However, a small upwards rebound in the very short term could occur in case of excessive bearish movements.
Force
0
10
8.2

Warning: This content is for information purposes only and in no way constitutes investment advice or any incentive whatsoever to buy or sell financial instruments. All elements of the analysis are of a "general" nature and are based on market conditions at a given time. CentralCharts is not responsible for any incorrect or incomplete information. Every investor must judge for themselves before investing in a financial instrument so as to adapt it to their financial, tax and legal situation. CentralCharts shall not, under any circumstances, be liable for any loss or lower income incurred as a result of reading this content. Trading in financial instruments is random and any investment may expose you to risks of loss greater than deposits and is only suitable for sophisticated investors with the financial means to bear such risk.
Additional analysis
Quotes
The EXELON CORP. price is 35.81 USD. The price is lower by -1.27% since the last closing and was traded between 35.75 USD and 36.35 USD over the period. The price is currently at +0.17% from its lowest and -1.49% from its highest.35.75
36.35
35.81
The Central Gaps scanner detects a bullish opening marking the presence of buyers ahead of sellers at the opening but not sufficiently marked to allow the price to register a quotation gap.
Bullish opening
Type : Bullish
Timeframe : Openning
Here is a more detailed summary of the historical variations registered by EXELON CORP.:
Near a new HIGH record (1st january)
Type : Bullish
Timeframe : Weekly
Near a new HIGH record (1 month)
Type : Bullish
Timeframe : Weekly
New LOW record (1 month)
Type : Bearish
Timeframe : Weekly
Technical
Technical analysis of this 1H chart of EXELON CORP. indicates that the overall trend is strongly bearish. 92.86% of the signals given by moving averages are bearish. The overall trend is supported by the strong bearish signals from short-term moving averages. The Central Indicators scanner does not detect any result on moving averages that would impact this trend.
The probability of a further decline is high given the direction of the technical indicators.
But beware of excesses. The Central Indicators scanner currently detects this:
CCI indicator is oversold : under -100
Type : Neutral
Timeframe : 1 hour
Williams %R indicator is oversold : under -80
Type : Neutral
Timeframe : 1 hour
Pivot points : price is under support 1
Type : Neutral
Timeframe : 1 hour
An analysis of the price chart with the Central Patterns scanner (detector of chart patterns and resistances and supports) shows a result that can have an impact on the price change:
Support of channel is broken
Type : Bearish
Timeframe : 1 hour
The presence of a bearish pattern in Japanese candlesticks detected by Central Candlesticks that could cause a correction in the very short term was also detected:
Bearish engulfing lines
Type : Bearish
Timeframe : 1 hour
ProTrendLines
S3
S2
S1
R1
R2
R3
Price
| S3 | S2 | S1 | Price | R1 | R2 | R3 | |
|---|---|---|---|---|---|---|---|
| ProTrendLines | 31.32 | 33.62 | 34.92 | 35.81 | 35.88 | 36.20 | 36.52 |
| Change (%) | -12.54% | -6.12% | -2.49% | - | +0.20% | +1.09% | +1.98% |
| Change | -4.49 | -2.19 | -0.89 | - | +0.07 | +0.39 | +0.71 |
| Level | Intermediate | Major | Minor | - | Major | Intermediate | Major |
To determine price objectives, it is also possible to use the pivot points. Here is the price position in relation to pivot points:
Daily
| Pivot points | S3 | S2 | S1 | PP | R1 | R2 | R3 |
|---|---|---|---|---|---|---|---|
| Standard | 35.17 | 35.62 | 35.94 | 36.39 | 36.71 | 37.16 | 37.48 |
| Camarilla | 36.06 | 36.13 | 36.20 | 36.27 | 36.34 | 36.41 | 36.48 |
| Woodie | 35.12 | 35.59 | 35.89 | 36.36 | 36.66 | 37.13 | 37.43 |
| Fibonacci | 35.62 | 35.91 | 36.09 | 36.39 | 36.68 | 36.86 | 37.16 |
Weekly
| Pivot points | S3 | S2 | S1 | PP | R1 | R2 | R3 |
|---|---|---|---|---|---|---|---|
| Standard | 33.98 | 35.08 | 35.78 | 36.88 | 37.58 | 38.68 | 39.38 |
| Camarilla | 35.98 | 36.14 | 36.31 | 36.47 | 36.64 | 36.80 | 36.97 |
| Woodie | 33.77 | 34.98 | 35.57 | 36.78 | 37.37 | 38.58 | 39.17 |
| Fibonacci | 35.08 | 35.77 | 36.20 | 36.88 | 37.57 | 38.00 | 38.68 |
Monthly
| Pivot points | S3 | S2 | S1 | PP | R1 | R2 | R3 |
|---|---|---|---|---|---|---|---|
| Standard | 33.08 | 34.03 | 35.80 | 36.75 | 38.52 | 39.47 | 41.24 |
| Camarilla | 36.82 | 37.07 | 37.32 | 37.57 | 37.82 | 38.07 | 38.32 |
| Woodie | 33.49 | 34.24 | 36.21 | 36.96 | 38.93 | 39.68 | 41.65 |
| Fibonacci | 34.03 | 35.07 | 35.71 | 36.75 | 37.79 | 38.43 | 39.47 |
Numerical data
The following are the details of the technical indicators and moving averages that were collected to generate this technical analysis:
Technical indicators
Moving averages
| RSI (14): | 31.85 | |
| MACD (12,26,9): | -0.2500 | |
| Directional Movement: | -22.84 | |
| AROON (14): | -100.00 | |
| DEMA (21): | 36.17 | |
| Parabolic SAR (0,02-0,02-0,2): | 36.73 | |
| Elder Ray (13): | -0.26 | |
| Super Trend (3,10): | 36.92 | |
| Zig ZAG (10): | 35.91 | |
| VORTEX (21): | 0.8200 | |
| Stochastique (14,3,5): | 12.83 | |
| TEMA (21): | 36.08 | |
| Williams %R (14): | -92.35 | |
| Chande Momentum Oscillator (20): | -0.62 | |
| Repulse (5,40,3): | -1.3300 | |
| ROCnROLL: | 2 | |
| TRIX (15,9): | -0.0900 | |
| Courbe Coppock: | 2.81 |
| MA7: | 36.85 | |
| MA20: | 37.00 | |
| MA50: | 36.02 | |
| MA100: | 36.16 | |
| MAexp7: | 36.14 | |
| MAexp20: | 36.49 | |
| MAexp50: | 36.83 | |
| MAexp100: | 36.94 | |
| Price / MA7: | -2.82% | |
| Price / MA20: | -3.22% | |
| Price / MA50: | -0.58% | |
| Price / MA100: | -0.97% | |
| Price / MAexp7: | -0.91% | |
| Price / MAexp20: | -1.86% | |
| Price / MAexp50: | -2.77% | |
| Price / MAexp100: | -3.06% |
Quotes :
-
15 min delayed data
-
Actions NASDAQ
News
Don't forget to follow the news on EXELON CORP.. At the time of publication of this analysis, the latest news was as follows:
- Exelon Reports Second Quarter 2023 Results
- Exelon Appoints Anna Richo to Board of Directors
- Exelon Corporation Declares Dividend
- Colette D. Honorable to Join Exelon as Executive Vice President of Public Policy and Chief External Affairs Officer
- Climate Change Investment Initiative Paves the Way for Innovation in Baltimore