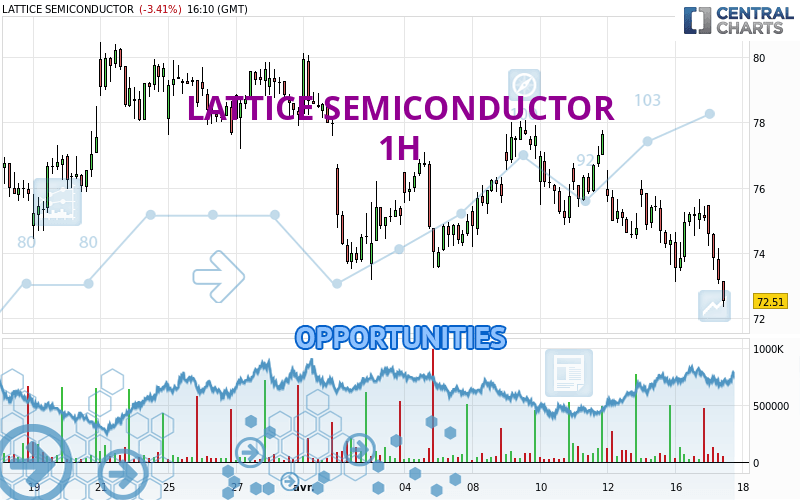
Londinia Opportunities Analyses - 04/17/2024 (GMT) LATTICE SEMICONDUCTOR - 1H
I am delighted to see that my first price objective has been achieved. I hope you've taken advantage of it.
- U.S. Stocks
- Timeframe : 1H
- - Analysis generated on
- Status : TARGET REACHED
Summary of the analysis
Trends
Short term:
Strongly bearish
Underlying:
Strongly bearish
Technical indicators
6%
83%
11%
My opinion
Bearish under 73.15 USD
My targets
71.26 USD (-1.71%)
69.35 USD (-4.34%)
My analysis
All elements being clearly bearish, it would be possible for traders to trade only short positions (for sale) on LATTICE SEMICONDUCTOR as long as the price remains well below 73.15 USD. The sellers' bearish objective is set at 71.26 USD. A bearish break of this support would revive the bearish momentum. The sellers could then target the support located at 69.35 USD. In case of crossing, the next objective would be the support located at 65.27 USD. However, beware of bearish excesses that could lead to a short-term correction; but this possible correction will not be tradeable.
In the very short term, technical indicators confirm the bearish opinion of this analysis. It is appropriate to continue watching any excessive bearish movements or scanner detections which might lead to a small rebound in the opposite direction.
Force
0
10
8.6

Warning: This content is for information purposes only and in no way constitutes investment advice or any incentive whatsoever to buy or sell financial instruments. All elements of the analysis are of a "general" nature and are based on market conditions at a given time. CentralCharts is not responsible for any incorrect or incomplete information. Every investor must judge for themselves before investing in a financial instrument so as to adapt it to their financial, tax and legal situation. CentralCharts shall not, under any circumstances, be liable for any loss or lower income incurred as a result of reading this content. Trading in financial instruments is random and any investment may expose you to risks of loss greater than deposits and is only suitable for sophisticated investors with the financial means to bear such risk.
Additional analysis
Quotes
The LATTICE SEMICONDUCTOR price is 72.50 USD. On the day, this instrument lost -3.42% and was traded between 72.39 USD and 75.46 USD over the period. The price is currently at +0.15% from its lowest and -3.92% from its highest.72.39
75.46
72.50
The Central Gaps scanner detects a bullish opening marking the presence of buyers ahead of sellers at the opening but not sufficiently marked to allow the price to register a quotation gap.
Bullish opening
Type : Bullish
Timeframe : Openning
A study of price movements over other periods shows the following variations:
Near a new LOW record (1 month)
Type : Bearish
Timeframe : Weekly
Technical
Technical analysis of LATTICE SEMICONDUCTOR in 1H shows a overall strongly bearish trend. 92.86% of the signals given by moving averages are bearish. This strongly bearish trend is supported by the strong bearish signals given by short-term moving averages. There is no crossing of moving average by the price or crossing of moving averages between themselves.
In fact, 15 technical indicators on 18 studied are currently positioned bearish. Caution: the Central Indicators scanner currently detects an excess:
CCI indicator is oversold : under -100
Type : Neutral
Timeframe : 1 hour
Williams %R indicator is oversold : under -80
Type : Neutral
Timeframe : 1 hour
Pivot points : price is under support 1
Type : Neutral
Timeframe : 1 hour
Pivot points : price is under support 1
Type : Neutral
Timeframe : Weekly
MACD crosses DOWN its Moving Average
Type : Bearish
Timeframe : 1 hour
Central Patterns, the scanner specializing in chart patterns, did not identify any signals.
The Central Candlesticks scanner which studies Japanese candlesticks did not detect anything.
ProTrendLines
S3
S2
S1
R1
R2
R3
Price
| S3 | S2 | S1 | Price | R1 | R2 | R3 | |
|---|---|---|---|---|---|---|---|
| ProTrendLines | 60.79 | 65.27 | 71.26 | 72.50 | 73.15 | 74.39 | 76.05 |
| Change (%) | -16.15% | -9.97% | -1.71% | - | +0.90% | +2.61% | +4.90% |
| Change | -11.71 | -7.23 | -1.24 | - | +0.65 | +1.89 | +3.55 |
| Level | Intermediate | Major | Intermediate | - | Minor | Intermediate | Major |
Attention could also be paid to pivot points to set price objectives:
Daily
| Pivot points | S3 | S2 | S1 | PP | R1 | R2 | R3 |
|---|---|---|---|---|---|---|---|
| Standard | 71.00 | 72.04 | 73.56 | 74.60 | 76.12 | 77.16 | 78.68 |
| Camarilla | 74.37 | 74.60 | 74.84 | 75.07 | 75.31 | 75.54 | 75.77 |
| Woodie | 71.23 | 72.16 | 73.79 | 74.72 | 76.35 | 77.28 | 78.91 |
| Fibonacci | 72.04 | 73.02 | 73.63 | 74.60 | 75.58 | 76.19 | 77.16 |
Weekly
| Pivot points | S3 | S2 | S1 | PP | R1 | R2 | R3 |
|---|---|---|---|---|---|---|---|
| Standard | 69.35 | 71.76 | 73.26 | 75.67 | 77.17 | 79.58 | 81.08 |
| Camarilla | 73.69 | 74.04 | 74.40 | 74.76 | 75.12 | 75.48 | 75.84 |
| Woodie | 68.90 | 71.53 | 72.81 | 75.44 | 76.72 | 79.35 | 80.63 |
| Fibonacci | 71.76 | 73.25 | 74.18 | 75.67 | 77.16 | 78.09 | 79.58 |
Monthly
| Pivot points | S3 | S2 | S1 | PP | R1 | R2 | R3 |
|---|---|---|---|---|---|---|---|
| Standard | 61.85 | 68.11 | 73.17 | 79.43 | 84.49 | 90.75 | 95.81 |
| Camarilla | 75.12 | 76.16 | 77.19 | 78.23 | 79.27 | 80.31 | 81.34 |
| Woodie | 61.25 | 67.81 | 72.57 | 79.13 | 83.89 | 90.45 | 95.21 |
| Fibonacci | 68.11 | 72.43 | 75.11 | 79.43 | 83.75 | 86.43 | 90.75 |
Numerical data
The following is the status of technical indicators and moving averages registered at the time this technical analysis was created:
Technical indicators
Moving averages
| RSI (14): | 36.01 | |
| MACD (12,26,9): | -0.4100 | |
| Directional Movement: | -17.30 | |
| AROON (14): | -92.86 | |
| DEMA (21): | 74.20 | |
| Parabolic SAR (0,02-0,02-0,2): | 75.61 | |
| Elder Ray (13): | -0.91 | |
| Super Trend (3,10): | 76.46 | |
| Zig ZAG (10): | 73.19 | |
| VORTEX (21): | 0.8700 | |
| Stochastique (14,3,5): | 30.25 | |
| TEMA (21): | 74.05 | |
| Williams %R (14): | -93.15 | |
| Chande Momentum Oscillator (20): | -1.41 | |
| Repulse (5,40,3): | -2.1700 | |
| ROCnROLL: | 2 | |
| TRIX (15,9): | -0.0700 | |
| Courbe Coppock: | 1.59 |
| MA7: | 75.44 | |
| MA20: | 76.55 | |
| MA50: | 75.57 | |
| MA100: | 70.24 | |
| MAexp7: | 73.90 | |
| MAexp20: | 74.71 | |
| MAexp50: | 75.30 | |
| MAexp100: | 75.93 | |
| Price / MA7: | -3.90% | |
| Price / MA20: | -5.29% | |
| Price / MA50: | -4.06% | |
| Price / MA100: | +3.22% | |
| Price / MAexp7: | -1.89% | |
| Price / MAexp20: | -2.96% | |
| Price / MAexp50: | -3.72% | |
| Price / MAexp100: | -4.52% |
Quotes :
-
15 min delayed data
-
Actions NASDAQ
News
The latest news and videos published on LATTICE SEMICONDUCTOR at the time of the analysis were as follows:
- Lattice Semiconductor to Present at KeyBanc Technology Leadership Forum
- Lattice Semiconductor Reports Second Quarter 2023 Results
- Lattice to Host Developers Conference
- Lattice Expands Software Portfolio with Lattice Drive Solution Stack to Accelerate Automotive Application Development
- Lattice Wins 2023 Environmental + Energy Leader Award with Lattice Avant FPGA Platform