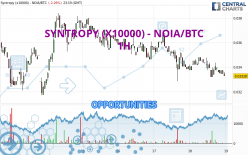
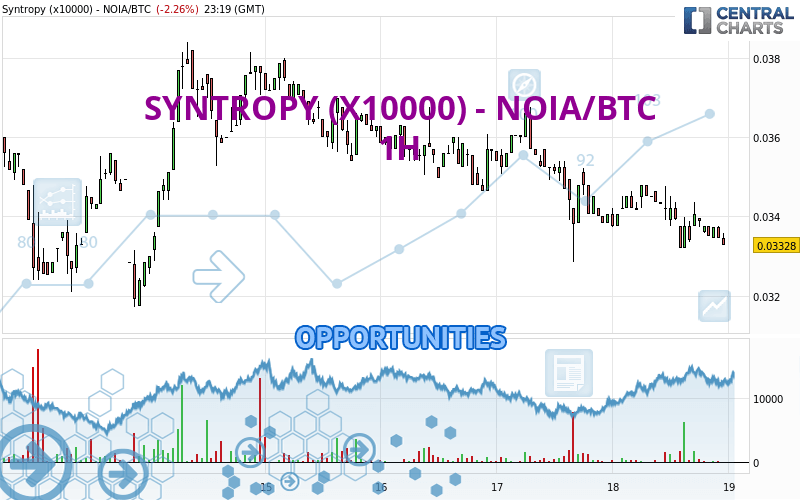
Londinia Opportunities Analyses - 04/18/2024 (GMT) SYNTROPY (X10000) - NOIA/BTC - 1H
| Type: | Cryptocurrencies |
| Ticker: | NOIABTC |
| ISIN: |
I am delighted to see that my first price objective has been achieved. I hope you've taken advantage of it.
- Cryptocurrencies
- Timeframe : 1H
- - Analysis generated on
- Status : TARGET REACHED
Summary of the analysis
Trends
Short term:
Strongly bearish
Underlying:
Strongly bearish
Technical indicators
11%
61%
28%
My opinion
Bearish under 0.033500 BTC
My targets
0.032850 BTC (-1.29%)
0.031706 BTC (-4.73%)
My analysis
All elements being clearly bearish, it would be possible for traders to trade only short positions (for sale) on SYNTROPY (X10000) - NOIA/BTC as long as the price remains well below 0.033500 BTC. The sellers' bearish objective is set at 0.032850 BTC. A bearish break of this support would revive the bearish momentum. The sellers could then target the support located at 0.031706 BTC. In case of crossing, the next objective would be the support located at 0.029928 BTC. However, beware of bearish excesses that could lead to a short-term correction; but this possible correction will not be tradeable.
In the very short term, the general bearish sentiment is confirmed by technical indicators. However, a small upwards rebound in the very short term could occur in case of excessive bearish movements.
Force
0
10
7.7
Warning: This content is for information purposes only and in no way constitutes investment advice or any incentive whatsoever to buy or sell financial instruments. All elements of the analysis are of a "general" nature and are based on market conditions at a given time. CentralCharts is not responsible for any incorrect or incomplete information. Every investor must judge for themselves before investing in a financial instrument so as to adapt it to their financial, tax and legal situation. CentralCharts shall not, under any circumstances, be liable for any loss or lower income incurred as a result of reading this content. Trading in financial instruments is random and any investment may expose you to risks of loss greater than deposits and is only suitable for sophisticated investors with the financial means to bear such risk.
Additional analysis
Quotes
The SYNTROPY (X10000) - NOIA/BTC rating is 0.033280 BTC. The price is lower by -2.26% since the last closing and was between 0.033200 BTC and 0.034780 BTC. This implies that the price is at +0.24% from its lowest and at -4.31% from its highest.0.033200
0.034780
0.033280
So that you have an overall view of the price change, here is a table showing the variations over several periods:
Technical
Technical analysis of SYNTROPY (X10000) - NOIA/BTC in 1H shows a overall strongly bearish trend. The signals given by moving averages are 92.86% bearish. This strong bearish trend is confirmed by the strong signals currently being given by short-term moving averages. There is no crossing of moving average by the price or crossing of moving averages between themselves.
In fact, according to the parameters integrated into the Central Analyzer system, 11 technical indicators out of 18 analysed are currently bearish. Caution: the Central Indicators scanner currently detects an excess:
CCI indicator is oversold : under -100
Type : Neutral
Timeframe : 1 hour
Williams %R indicator is oversold : under -80
Type : Neutral
Timeframe : 1 hour
An analysis of the price chart with the Central Patterns scanner (detector of chart patterns and resistances and supports) shows a result that can have an impact on the price change:
Near support of triangle
Type : Bullish
Timeframe : 1 hour
No result was found by the Central Candlesticks scanner on Japanese candlesticks.
ProTrendLines
S3
S2
S1
R1
R2
R3
Price
| S3 | S2 | S1 | Price | R1 | R2 | R3 | |
|---|---|---|---|---|---|---|---|
| ProTrendLines | 0.029928 | 0.031706 | 0.032850 | 0.033280 | 0.033500 | 0.034650 | 0.035400 |
| Change (%) | -10.07% | -4.73% | -1.29% | - | +0.66% | +4.12% | +6.37% |
| Change | -0.003352 | -0.001574 | -0.000430 | - | +0.000220 | +0.001370 | +0.002120 |
| Level | Major | Intermediate | Intermediate | - | Minor | Minor | Minor |
Attention could also be paid to pivot points to set price objectives:
Daily
| Pivot points | S3 | S2 | S1 | PP | R1 | R2 | R3 |
|---|---|---|---|---|---|---|---|
| Standard | 0.028263 | 0.030557 | 0.032303 | 0.034597 | 0.036343 | 0.038637 | 0.040383 |
| Camarilla | 0.032939 | 0.033309 | 0.033680 | 0.034050 | 0.034420 | 0.034791 | 0.035161 |
| Woodie | 0.027990 | 0.030420 | 0.032030 | 0.034460 | 0.036070 | 0.038500 | 0.040110 |
| Fibonacci | 0.030557 | 0.032100 | 0.033053 | 0.034597 | 0.036140 | 0.037093 | 0.038637 |
Weekly
| Pivot points | S3 | S2 | S1 | PP | R1 | R2 | R3 |
|---|---|---|---|---|---|---|---|
| Standard | 0.021130 | 0.025590 | 0.029220 | 0.033680 | 0.037310 | 0.041770 | 0.045400 |
| Camarilla | 0.030625 | 0.031367 | 0.032108 | 0.032850 | 0.033592 | 0.034333 | 0.035075 |
| Woodie | 0.020715 | 0.025383 | 0.028805 | 0.033473 | 0.036895 | 0.041563 | 0.044985 |
| Fibonacci | 0.025590 | 0.028680 | 0.030590 | 0.033680 | 0.036770 | 0.038680 | 0.041770 |
Monthly
| Pivot points | S3 | S2 | S1 | PP | R1 | R2 | R3 |
|---|---|---|---|---|---|---|---|
| Standard | 0.003193 | 0.015137 | 0.024203 | 0.036147 | 0.045213 | 0.057157 | 0.066223 |
| Camarilla | 0.027492 | 0.029418 | 0.031344 | 0.033270 | 0.035196 | 0.037122 | 0.039048 |
| Woodie | 0.001755 | 0.014418 | 0.022765 | 0.035428 | 0.043775 | 0.056438 | 0.064785 |
| Fibonacci | 0.015137 | 0.023163 | 0.028121 | 0.036147 | 0.044173 | 0.049131 | 0.057157 |
Numerical data
The following are the details of the technical indicators and moving averages that were collected to generate this technical analysis:
Technical indicators
Moving averages
| RSI (14): | 40.02 | |
| MACD (12,26,9): | -0.0003 | |
| Directional Movement: | -1.051318 | |
| AROON (14): | -21.428572 | |
| DEMA (21): | 0.033483 | |
| Parabolic SAR (0,02-0,02-0,2): | 0.034517 | |
| Elder Ray (13): | -0.000298 | |
| Super Trend (3,10): | 0.034716 | |
| Zig ZAG (10): | 0.033280 | |
| VORTEX (21): | 0.8402 | |
| Stochastique (14,3,5): | 18.05 | |
| TEMA (21): | 0.033452 | |
| Williams %R (14): | -94.90 | |
| Chande Momentum Oscillator (20): | -0.000920 | |
| Repulse (5,40,3): | -1.4166 | |
| ROCnROLL: | 2 | |
| TRIX (15,9): | -0.1130 | |
| Courbe Coppock: | 4.56 |
| MA7: | 0.034704 | |
| MA20: | 0.033246 | |
| MA50: | 0.035976 | |
| MA100: | 0.031920 | |
| MAexp7: | 0.033571 | |
| MAexp20: | 0.033874 | |
| MAexp50: | 0.034409 | |
| MAexp100: | 0.034759 | |
| Price / MA7: | -4.10% | |
| Price / MA20: | +0.10% | |
| Price / MA50: | -7.49% | |
| Price / MA100: | +4.26% | |
| Price / MAexp7: | -0.87% | |
| Price / MAexp20: | -1.75% | |
| Price / MAexp50: | -3.28% | |
| Price / MAexp100: | -4.26% |
Quotes :
-
Real time data
-
Cryptocompare