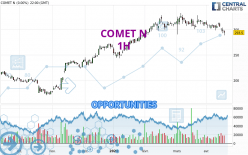
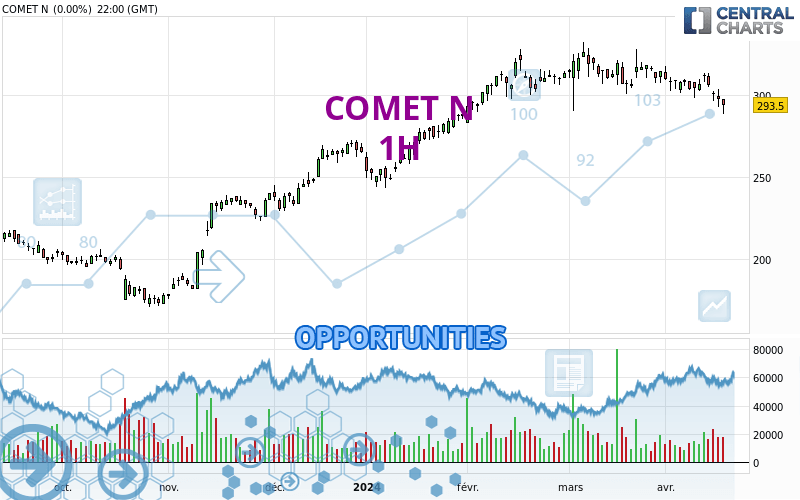
Londinia Opportunities Analyses - 04/19/2024 (GMT) COMET N - 1H
-
CHF
(-)
-
15 min delayed data - Switzerland SWX Stocks
| Type: | Stocks |
| Ticker: | COTN |
| ISIN: | CH0360826991 |
I am pleased to note that the threshold for invalidation has been maintained for 20 Candlesticks.
- Europe Stocks
- Timeframe : 1H
- - Analysis generated on
- Status : LEVEL MAINTAINED
Summary of the analysis
Trends
Short term:
Strongly bearish
Underlying:
Strongly bearish
Technical indicators
11%
72%
17%
My opinion
Bearish under 292.5 CHF
My targets
270.4 CHF (-5.45%)
252.7 CHF (-11.64%)
My analysis
COMET N is part of a very strong bearish trend. Traders may consider trading only short positions (for sale) as long as the price remains well below 292.5 CHF. The next support located at 270.4 CHF is the next bearish objective to target. A bearish break of this support would revive the bearish momentum. The bearish movement could then continue towards the next support located at 252.7 CHF. Below this support, sellers could then target 230.5 CHF. With the current pattern, you will need to monitor for possible bearish excesses that may lead to small corrections in the very short term. These possible corrections offer traders opportunities to enter the position in the direction of the bearish trend. Trying to profit from the purchase of these possible corrections may seem risky.
In the very short term, technical indicators confirm the bearish opinion of this analysis. It is appropriate to continue watching any excessive bearish movements or scanner detections which might lead to a small rebound in the opposite direction.
Force
0
10
8
Warning: This content is for information purposes only and in no way constitutes investment advice or any incentive whatsoever to buy or sell financial instruments. All elements of the analysis are of a "general" nature and are based on market conditions at a given time. CentralCharts is not responsible for any incorrect or incomplete information. Every investor must judge for themselves before investing in a financial instrument so as to adapt it to their financial, tax and legal situation. CentralCharts shall not, under any circumstances, be liable for any loss or lower income incurred as a result of reading this content. Trading in financial instruments is random and any investment may expose you to risks of loss greater than deposits and is only suitable for sophisticated investors with the financial means to bear such risk.
Additional analysis
Quotes
The COMET N rating is 286.0 CHF. The price is lower by -2.56% since the last closing and was between 280.0 CHF and 290.0 CHF. This implies that the price is at +2.14% from its lowest and at -1.38% from its highest.280.0
290.0
286.0
A bearish opening was detected by the Central Gaps scanner. Sellers are trying to impose a bearish trend in the very short term.
Bearish opening
Type : Bearish
Timeframe : Openning
A study of price movements over other periods shows the following variations:
New LOW record (1 month)
Type : Bearish
Timeframe : Weekly
Technical
A technical analysis in 1H of this COMET N chart shows a sharp bearish trend. 92.86% of the signals given by moving averages are bearish. The overall trend is supported by the strong bearish signals from short-term moving averages. The Central Indicators market scanner currently does not detect any result that concerns moving averages.
In fact, 13 technical indicators on 18 studied are currently bearish. But beware of excesses. The Central Indicators scanner currently detects this:
CCI indicator is oversold : under -100
Type : Neutral
Timeframe : 1 hour
Pivot points : price is under support 1
Type : Neutral
Timeframe : 1 hour
Pivot points : price is under support 1
Type : Neutral
Timeframe : Weekly
The analysis of the price chart with Central Patterns scanners does not return any result.
From the Japanese candlestick perspective, the Central Candlesticks scanner notes the presence of these results that could impact the short-term trend:
Doji
Type : Neutral
Timeframe : 1 hour
Long black line
Type : Bearish
Timeframe : 1 hour
ProTrendLines
S3
S2
S1
R1
R2
R3
Price
| S3 | S2 | S1 | Price | R1 | R2 | R3 | |
|---|---|---|---|---|---|---|---|
| ProTrendLines | 230.5 | 252.7 | 270.4 | 286.0 | 292.5 | 301.0 | 306.4 |
| Change (%) | -19.41% | -11.64% | -5.45% | - | +2.27% | +5.24% | +7.13% |
| Change | -55.5 | -33.3 | -15.6 | - | +6.5 | +15.0 | +20.4 |
| Level | Intermediate | Intermediate | Intermediate | - | Intermediate | Minor | Intermediate |
Attention could also be paid to pivot points to set price objectives:
Daily
| Pivot points | S3 | S2 | S1 | PP | R1 | R2 | R3 |
|---|---|---|---|---|---|---|---|
| Standard | 279.0 | 283.5 | 288.5 | 293.0 | 298.0 | 302.5 | 307.5 |
| Camarilla | 290.9 | 291.8 | 292.6 | 293.5 | 294.4 | 295.2 | 296.1 |
| Woodie | 279.3 | 283.6 | 288.8 | 293.1 | 298.3 | 302.6 | 307.8 |
| Fibonacci | 283.5 | 287.1 | 289.4 | 293.0 | 296.6 | 298.9 | 302.5 |
Weekly
| Pivot points | S3 | S2 | S1 | PP | R1 | R2 | R3 |
|---|---|---|---|---|---|---|---|
| Standard | 287.3 | 292.7 | 302.3 | 307.7 | 317.3 | 322.7 | 332.3 |
| Camarilla | 307.9 | 309.3 | 310.6 | 312.0 | 313.4 | 314.8 | 316.1 |
| Woodie | 289.5 | 293.8 | 304.5 | 308.8 | 319.5 | 323.8 | 334.5 |
| Fibonacci | 292.7 | 298.4 | 301.9 | 307.7 | 313.4 | 316.9 | 322.7 |
Monthly
| Pivot points | S3 | S2 | S1 | PP | R1 | R2 | R3 |
|---|---|---|---|---|---|---|---|
| Standard | 250.2 | 270.2 | 292.2 | 312.2 | 334.2 | 354.2 | 376.2 |
| Camarilla | 302.7 | 306.5 | 310.4 | 314.2 | 318.1 | 321.9 | 325.8 |
| Woodie | 251.2 | 270.7 | 293.2 | 312.7 | 335.2 | 354.7 | 377.2 |
| Fibonacci | 270.2 | 286.2 | 296.2 | 312.2 | 328.2 | 338.2 | 354.2 |
Numerical data
The following is the status of the technical indicators and moving averages at the time of publication of this technical analysis:
Technical indicators
Moving averages
| RSI (14): | 30.90 | |
| MACD (12,26,9): | -3.3000 | |
| Directional Movement: | -33.2 | |
| AROON (14): | -85.7 | |
| DEMA (21): | 290.9 | |
| Parabolic SAR (0,02-0,02-0,2): | 299.1 | |
| Elder Ray (13): | -8.3 | |
| Super Trend (3,10): | 297.4 | |
| Zig ZAG (10): | 288.0 | |
| VORTEX (21): | 0.7000 | |
| Stochastique (14,3,5): | 30.80 | |
| TEMA (21): | 289.3 | |
| Williams %R (14): | -68.90 | |
| Chande Momentum Oscillator (20): | -11.5 | |
| Repulse (5,40,3): | 1.6000 | |
| ROCnROLL: | 2 | |
| TRIX (15,9): | -0.1000 | |
| Courbe Coppock: | 5.90 |
| MA7: | 300.5 | |
| MA20: | 307.3 | |
| MA50: | 310.5 | |
| MA100: | 286.3 | |
| MAexp7: | 291.4 | |
| MAexp20: | 295.0 | |
| MAexp50: | 299.6 | |
| MAexp100: | 303.1 | |
| Price / MA7: | -4.83% | |
| Price / MA20: | -6.93% | |
| Price / MA50: | -7.89% | |
| Price / MA100: | -0.10% | |
| Price / MAexp7: | -1.85% | |
| Price / MAexp20: | -3.05% | |
| Price / MAexp50: | -4.54% | |
| Price / MAexp100: | -5.64% |
Quotes :
-
15 min delayed data
-
Actions Suisse SWX
News
The latest news and videos published on COMET N at the time of the analysis were as follows:
- Comet confirms guidance despite the expected slow start to the financial year
- Comet proposes changes to the Board of Directors
- 2024: Returning to growth after a transition year
- Comet Holding AG – Presentation of the Full-Year Results 2023
- Comet achieves full-year 2023 profitability above recent guidance, recovery in semiconductor cycle expected in 2024