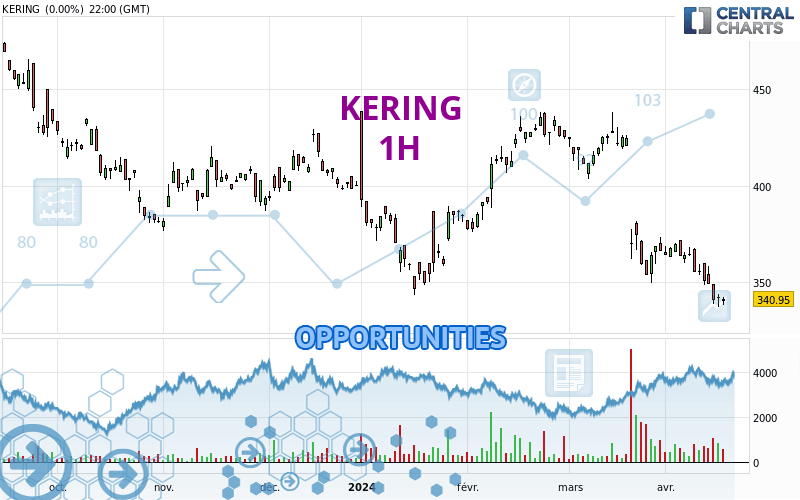
Londinia Opportunities Analyses - 04/19/2024 (GMT) KERING - 1H
| Type: | Stocks |
| Ticker: | 1KER |
| ISIN: | FR0000121485 |
- Europe Stocks
- Timeframe : 1H
- - Analysis generated on
- Status : INVALID
Summary of the analysis

Additional analysis
Quotes
KERING rating 335.00 EUR. The price is lower by -1.75% since the last closing and was traded between 334.80 EUR and 336.70 EUR over the period. The price is currently at +0.06% from its lowest and -0.50% from its highest.The Central Gaps scanner detects the formation of a bearish gap marking the strong presence of sellers ahead of buyers at the opening. This formed a quotation gap.
Opening Gap DOWN
Type : Bearish
Timeframe : Openning
Here is a more detailed summary of the historical variations registered by KERING:
New LOW record (5 years)
Type : Bearish
Timeframe : Weekly
New LOW record (1 year)
Type : Bearish
Timeframe : Weekly
New LOW record (1st january)
Type : Bearish
Timeframe : Weekly
New LOW record (1 month)
Type : Bearish
Timeframe : Weekly
The Central Volumes scanner detects abnormal volumes on the asset:
Abnormal volumes
Timeframe : 20 days
Abnormal volumes
Timeframe : 50 days
Technical
Technical analysis of this 1H chart of KERING indicates that the overall trend is strongly bearish. 92.86% of the signals given by moving averages are bearish. This strongly bearish trend is supported by the strong bearish signals given by short-term moving averages. There is no crossing of moving average by the price or crossing of moving averages between themselves.
An assessment of technical indicators shows a strong bearish signal.
Caution: the Central Indicators scanner currently detects an excess:
CCI indicator is oversold : under -100
Type : Neutral
Timeframe : 1 hour
Previous candle closed under Bollinger bands
Type : Neutral
Timeframe : 1 hour
Williams %R indicator is oversold : under -80
Type : Neutral
Timeframe : 1 hour
Pivot points : price is under support 3
Type : Neutral
Timeframe : 1 hour
Pivot points : price is under support 3
Type : Neutral
Timeframe : Weekly
The Central Patterns scanner, which studies chart patterns, resistances and supports, has identified this signal:
Support of channel is broken
Type : Bearish
Timeframe : 1 hour
The Central Candlesticks scanner which studies Japanese candlesticks did not detect anything.
| S2 | S1 | Price | R1 | R2 | R3 | |
|---|---|---|---|---|---|---|
| ProTrendLines | 30.61 | 131.87 | 335.00 | 343.73 | 350.95 | 359.65 |
| Change (%) | -90.86% | -60.64% | - | +2.61% | +4.76% | +7.36% |
| Change | -304.39 | -203.13 | - | +8.73 | +15.95 | +24.65 |
| Level | Minor | Intermediate | - | Intermediate | Major | Major |
Attention could also be paid to pivot points to set price objectives:
| Pivot points | S3 | S2 | S1 | PP | R1 | R2 | R3 |
|---|---|---|---|---|---|---|---|
| Standard | 334.63 | 336.32 | 338.63 | 340.32 | 342.63 | 344.32 | 346.63 |
| Camarilla | 339.85 | 340.22 | 340.58 | 340.95 | 341.32 | 341.68 | 342.05 |
| Woodie | 334.95 | 336.48 | 338.95 | 340.48 | 342.95 | 344.48 | 346.95 |
| Fibonacci | 336.32 | 337.85 | 338.79 | 340.32 | 341.85 | 342.79 | 344.32 |
| Pivot points | S3 | S2 | S1 | PP | R1 | R2 | R3 |
|---|---|---|---|---|---|---|---|
| Standard | 323.07 | 335.73 | 342.97 | 355.63 | 362.87 | 375.53 | 382.77 |
| Camarilla | 344.73 | 346.55 | 348.38 | 350.20 | 352.02 | 353.85 | 355.67 |
| Woodie | 320.35 | 334.38 | 340.25 | 354.28 | 360.15 | 374.18 | 380.05 |
| Fibonacci | 335.73 | 343.34 | 348.03 | 355.63 | 363.24 | 367.93 | 375.53 |
| Pivot points | S3 | S2 | S1 | PP | R1 | R2 | R3 |
|---|---|---|---|---|---|---|---|
| Standard | 242.33 | 295.87 | 330.93 | 384.47 | 419.53 | 473.07 | 508.13 |
| Camarilla | 341.64 | 349.76 | 357.88 | 366.00 | 374.12 | 382.24 | 390.37 |
| Woodie | 233.10 | 291.25 | 321.70 | 379.85 | 410.30 | 468.45 | 498.90 |
| Fibonacci | 295.87 | 329.71 | 350.62 | 384.47 | 418.31 | 439.22 | 473.07 |
Numerical data
The following is the status of technical indicators and moving averages registered at the time this technical analysis was created:
| RSI (14): | 30.60 | |
| MACD (12,26,9): | -2.5700 | |
| Directional Movement: | -35.10 | |
| AROON (14): | -78.57 | |
| DEMA (21): | 336.82 | |
| Parabolic SAR (0,02-0,02-0,2): | 340.83 | |
| Elder Ray (13): | -3.65 | |
| Super Trend (3,10): | 340.79 | |
| Zig ZAG (10): | 335.00 | |
| VORTEX (21): | 0.9200 | |
| Stochastique (14,3,5): | 4.07 | |
| TEMA (21): | 336.88 | |
| Williams %R (14): | -97.78 | |
| Chande Momentum Oscillator (20): | -6.50 | |
| Repulse (5,40,3): | -0.4600 | |
| ROCnROLL: | 2 | |
| TRIX (15,9): | -0.1000 | |
| Courbe Coppock: | 2.03 |
| MA7: | 344.64 | |
| MA20: | 357.37 | |
| MA50: | 395.15 | |
| MA100: | 390.02 | |
| MAexp7: | 337.52 | |
| MAexp20: | 340.25 | |
| MAexp50: | 345.54 | |
| MAexp100: | 353.20 | |
| Price / MA7: | -2.80% | |
| Price / MA20: | -6.26% | |
| Price / MA50: | -15.22% | |
| Price / MA100: | -14.11% | |
| Price / MAexp7: | -0.75% | |
| Price / MAexp20: | -1.54% | |
| Price / MAexp50: | -3.05% | |
| Price / MAexp100: | -5.15% |