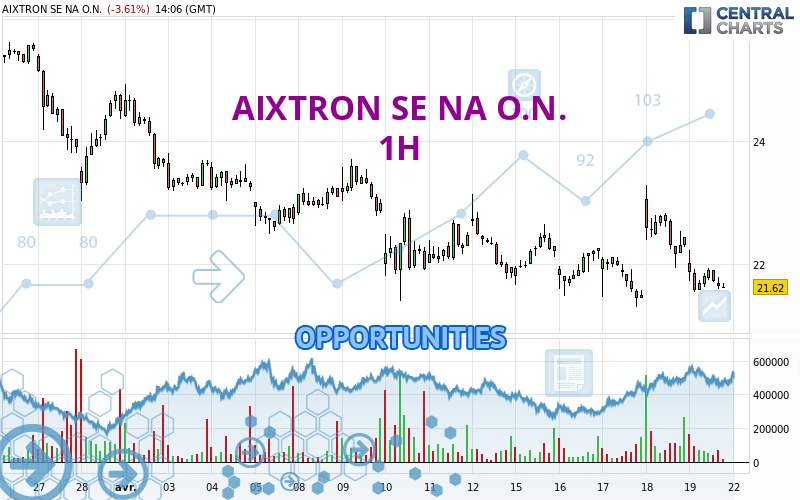
Londinia Opportunities Analyses - 04/19/2024 (GMT) AIXTRON SE NA O.N. - 1H
-
EUR
(-)
-
15 min delayed data - Germany Stocks
| Type: | Stocks |
| Ticker: | AIXA |
| ISIN: | DE000A0WMPJ6 |
- Europe Stocks
- Timeframe : 1H
- - Analysis generated on
- Status : INVALID
Summary of the analysis
Trends
Short term:
Strongly bearish
Underlying:
Strongly bearish
Technical indicators
11%
67%
22%
My opinion
Bearish under 21.91 EUR
My targets
21.39 EUR (-1.34%)
20.01 EUR (-7.69%)
My analysis
The bearish trend is currently very strong for AIXTRON SE NA O.N.. As long as the price remains below the resistance at 21.91 EUR, you could try to take advantage of the bearish rally. The first bearish objective is located at 21.39 EUR. The bearish momentum would be revived by a break in this support. Sellers would then use the next support located at 20.01 EUR as an objective. Crossing it would then enable sellers to target 18.84 EUR. Be careful, given the powerful bearish rally underway, excesses could lead to a short-term rebound. If this is the case, remember that trading against the trend may be riskier. It would seem more appropriate to wait for a signal indicating reversal of the trend.
In the very short term, the general bearish sentiment is confirmed by technical indicators. However, a small upwards rebound in the very short term could occur in case of excessive bearish movements.
Force
0
10
7.9

Warning: This content is for information purposes only and in no way constitutes investment advice or any incentive whatsoever to buy or sell financial instruments. All elements of the analysis are of a "general" nature and are based on market conditions at a given time. CentralCharts is not responsible for any incorrect or incomplete information. Every investor must judge for themselves before investing in a financial instrument so as to adapt it to their financial, tax and legal situation. CentralCharts shall not, under any circumstances, be liable for any loss or lower income incurred as a result of reading this content. Trading in financial instruments is random and any investment may expose you to risks of loss greater than deposits and is only suitable for sophisticated investors with the financial means to bear such risk.
Additional analysis
Quotes
AIXTRON SE NA O.N. rating 21.68 EUR. On the day, this instrument lost -3.34% and was traded between 21.54 EUR and 22.22 EUR over the period. The price is currently at +0.65% from its lowest and -2.43% from its highest.21.54
22.22
21.68
The Central Gaps scanner detects a bearish opening. A small advantage for sellers in the very short term.
Bearish opening
Type : Bearish
Timeframe : Openning
So that you have an overall view of the price change, here is a table showing the variations over several periods:
Near a new LOW record (1 year)
Type : Bearish
Timeframe : Weekly
Near a new LOW record (1st january)
Type : Bearish
Timeframe : Weekly
Near a new LOW record (1 month)
Type : Bearish
Timeframe : Weekly
Technical
A technical analysis in 1H of this AIXTRON SE NA O.N. chart shows a sharp bearish trend. 92.86% of the signals given by moving averages are bearish. The overall trend is supported by the strong bearish signals from short-term moving averages. The Central Indicators market scanner currently does not detect any result that concerns moving averages.
An assessment of technical indicators shows a bearish signal.
But beware of excesses. The Central Indicators scanner currently detects this:
Williams %R indicator is oversold : under -80
Type : Neutral
Timeframe : 1 hour
Pivot points : price is under support 1
Type : Neutral
Timeframe : 1 hour
Central Patterns, the market scanner focusing on chart patterns, resistances and supports found this result:
Near support of triangle
Type : Bullish
Timeframe : 1 hour
The Central Candlesticks scanner currently notes the presence of this pattern in Japanese candlesticks that could mark the end of the short-term trend currently underway:
Doji
Type : Neutral
Timeframe : 1 hour
ProTrendLines
S3
S2
S1
R1
R2
R3
Price
| S3 | S2 | S1 | Price | R1 | R2 | R3 | |
|---|---|---|---|---|---|---|---|
| ProTrendLines | 15.78 | 18.84 | 21.39 | 21.68 | 21.91 | 22.83 | 23.71 |
| Change (%) | -27.21% | -13.10% | -1.34% | - | +1.06% | +5.30% | +9.36% |
| Change | -5.90 | -2.84 | -0.29 | - | +0.23 | +1.15 | +2.03 |
| Level | Intermediate | Major | Major | - | Major | Minor | Minor |
To determine price objectives, it is also possible to use the pivot points. Here is the price position in relation to pivot points:
Daily
| Pivot points | S3 | S2 | S1 | PP | R1 | R2 | R3 |
|---|---|---|---|---|---|---|---|
| Standard | 20.43 | 21.18 | 21.80 | 22.55 | 23.17 | 23.92 | 24.54 |
| Camarilla | 22.05 | 22.18 | 22.30 | 22.43 | 22.56 | 22.68 | 22.81 |
| Woodie | 20.38 | 21.15 | 21.75 | 22.52 | 23.12 | 23.89 | 24.49 |
| Fibonacci | 21.18 | 21.70 | 22.02 | 22.55 | 23.07 | 23.39 | 23.92 |
Weekly
| Pivot points | S3 | S2 | S1 | PP | R1 | R2 | R3 |
|---|---|---|---|---|---|---|---|
| Standard | 18.65 | 20.01 | 20.98 | 22.34 | 23.31 | 24.67 | 25.64 |
| Camarilla | 21.30 | 21.51 | 21.73 | 21.94 | 22.15 | 22.37 | 22.58 |
| Woodie | 18.45 | 19.91 | 20.78 | 22.24 | 23.11 | 24.57 | 25.44 |
| Fibonacci | 20.01 | 20.90 | 21.45 | 22.34 | 23.23 | 23.78 | 24.67 |
Monthly
| Pivot points | S3 | S2 | S1 | PP | R1 | R2 | R3 |
|---|---|---|---|---|---|---|---|
| Standard | 16.27 | 19.65 | 22.07 | 25.45 | 27.87 | 31.25 | 33.67 |
| Camarilla | 22.91 | 23.44 | 23.97 | 24.50 | 25.03 | 25.56 | 26.10 |
| Woodie | 15.80 | 19.41 | 21.60 | 25.21 | 27.40 | 31.01 | 33.20 |
| Fibonacci | 19.65 | 21.86 | 23.23 | 25.45 | 27.66 | 29.03 | 31.25 |
Numerical data
The following is the status of technical indicators and moving averages registered at the time this technical analysis was created:
Technical indicators
Moving averages
| RSI (14): | 42.84 | |
| MACD (12,26,9): | -0.1000 | |
| Directional Movement: | -7.58 | |
| AROON (14): | -42.86 | |
| DEMA (21): | 21.88 | |
| Parabolic SAR (0,02-0,02-0,2): | 23.12 | |
| Elder Ray (13): | -0.25 | |
| Super Trend (3,10): | 22.61 | |
| Zig ZAG (10): | 21.69 | |
| VORTEX (21): | 0.8100 | |
| Stochastique (14,3,5): | 15.26 | |
| TEMA (21): | 21.82 | |
| Williams %R (14): | -93.75 | |
| Chande Momentum Oscillator (20): | -1.18 | |
| Repulse (5,40,3): | -0.2400 | |
| ROCnROLL: | 2 | |
| TRIX (15,9): | -0.0200 | |
| Courbe Coppock: | 3.17 |
| MA7: | 22.07 | |
| MA20: | 23.36 | |
| MA50: | 27.38 | |
| MA100: | 31.31 | |
| MAexp7: | 21.77 | |
| MAexp20: | 21.98 | |
| MAexp50: | 22.14 | |
| MAexp100: | 22.55 | |
| Price / MA7: | -1.77% | |
| Price / MA20: | -7.19% | |
| Price / MA50: | -20.82% | |
| Price / MA100: | -30.76% | |
| Price / MAexp7: | -0.41% | |
| Price / MAexp20: | -1.36% | |
| Price / MAexp50: | -2.08% | |
| Price / MAexp100: | -3.86% |
Quotes :
-
15 min delayed data
-
Actions Allemagne
News
Don't forget to follow the news on AIXTRON SE NA O.N.. At the time of publication of this analysis, the latest news was as follows:
- AIXTRON wins the prestigious German Innovation Award
- Wolfspeed Selects AIXTRON Tools to Support 200mm Production
- AIXTRON receives Gold Supplier Award from BOE HC SemiTek for Micro LED collaboration
- EQS-News: AIXTRON: New shares from stock option program with separate ISIN
- EQS-News: AIXTRON - growth trajectory continued