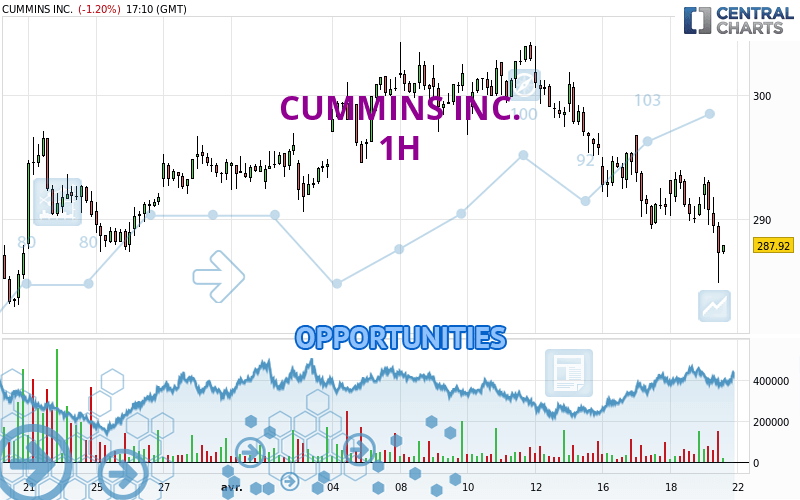
Londinia Opportunities Analyses - 04/19/2024 (GMT) CUMMINS INC. - 1H
- U.S. Stocks
- Timeframe : 1H
- - Analysis generated on
- Status : LEVEL MAINTAINED
Summary of the analysis

Additional analysis
Quotes
The CUMMINS INC. price is 287.43 USD. The price is lower by -1.37% since the last closing and was between 284.92 USD and 293.43 USD. This implies that the price is at +0.88% from its lowest and at -2.04% from its highest.The Central Gaps scanner detects a bullish opening marking the presence of buyers ahead of sellers at the opening but not sufficiently marked to allow the price to register a quotation gap.
Bullish opening
Type : Bullish
Timeframe : Openning
So that you have an overall view of the price change, here is a table showing the variations over several periods:
Near a new HIGH record (5 years)
Type : Bullish
Timeframe : Weekly
Near a new HIGH record (1 year)
Type : Bullish
Timeframe : Weekly
Near a new HIGH record (1st january)
Type : Bullish
Timeframe : Weekly
Near a new HIGH record (1 month)
Type : Bullish
Timeframe : Weekly
Abnormal volumes on CUMMINS INC. were detected by the Central Volumes scanner:
Abnormal volumes
Timeframe : 50 days
Technical
Technical analysis of this 1H chart of CUMMINS INC. indicates that the overall trend is strongly bearish. 92.86% of the signals given by moving averages are bearish. The overall trend is supported by the strong bearish signals from short-term moving averages. There is no crossing of moving average by the price or crossing of moving averages between themselves.
An assessment of technical indicators shows a strong bearish signal.
Caution: the Central Indicators scanner currently detects an excess:
CCI indicator is oversold : under -100
Type : Neutral
Timeframe : 1 hour
Williams %R indicator is oversold : under -80
Type : Neutral
Timeframe : 1 hour
Pivot points : price is under support 3
Type : Neutral
Timeframe : 1 hour
Pivot points : price is under support 3
Type : Neutral
Timeframe : Weekly
MACD crosses DOWN its Moving Average
Type : Bearish
Timeframe : 1 hour
Central Patterns, the scanner specializing in chart patterns, did not identify any signals.
The Central Candlesticks scanner which studies Japanese candlesticks did not detect anything.
| S3 | S2 | S1 | Price | R1 | R2 | R3 | |
|---|---|---|---|---|---|---|---|
| ProTrendLines | 260.90 | 265.40 | 275.99 | 287.43 | 287.58 | 296.91 | 302.86 |
| Change (%) | -9.23% | -7.66% | -3.98% | - | +0.05% | +3.30% | +5.37% |
| Change | -26.53 | -22.03 | -11.44 | - | +0.15 | +9.48 | +15.43 |
| Level | Intermediate | Minor | Major | - | Major | Intermediate | Major |
To determine price objectives, it is also possible to use the pivot points. Here is the price position in relation to pivot points:
| Pivot points | S3 | S2 | S1 | PP | R1 | R2 | R3 |
|---|---|---|---|---|---|---|---|
| Standard | 285.13 | 287.41 | 289.42 | 291.70 | 293.71 | 295.99 | 298.00 |
| Camarilla | 290.24 | 290.63 | 291.03 | 291.42 | 291.81 | 292.21 | 292.60 |
| Woodie | 284.99 | 287.34 | 289.28 | 291.63 | 293.57 | 295.92 | 297.86 |
| Fibonacci | 287.41 | 289.05 | 290.07 | 291.70 | 293.34 | 294.36 | 295.99 |
| Pivot points | S3 | S2 | S1 | PP | R1 | R2 | R3 |
|---|---|---|---|---|---|---|---|
| Standard | 288.03 | 292.40 | 295.51 | 299.88 | 302.99 | 307.36 | 310.47 |
| Camarilla | 296.57 | 297.26 | 297.94 | 298.63 | 299.32 | 300.00 | 300.69 |
| Woodie | 287.41 | 292.09 | 294.89 | 299.57 | 302.37 | 307.05 | 309.85 |
| Fibonacci | 292.40 | 295.25 | 297.02 | 299.88 | 302.73 | 304.50 | 307.36 |
| Pivot points | S3 | S2 | S1 | PP | R1 | R2 | R3 |
|---|---|---|---|---|---|---|---|
| Standard | 239.45 | 251.48 | 273.06 | 285.09 | 306.67 | 318.70 | 340.28 |
| Camarilla | 285.41 | 288.49 | 291.57 | 294.65 | 297.73 | 300.81 | 303.89 |
| Woodie | 244.24 | 253.87 | 277.85 | 287.48 | 311.46 | 321.09 | 345.07 |
| Fibonacci | 251.48 | 264.32 | 272.25 | 285.09 | 297.93 | 305.86 | 318.70 |
Numerical data
The following is the status of the technical indicators and moving averages at the time of publication of this technical analysis:
| RSI (14): | 31.48 | |
| MACD (12,26,9): | -1.7500 | |
| Directional Movement: | -17.05 | |
| AROON (14): | -57.14 | |
| DEMA (21): | 289.39 | |
| Parabolic SAR (0,02-0,02-0,2): | 293.33 | |
| Elder Ray (13): | -3.46 | |
| Super Trend (3,10): | 295.02 | |
| Zig ZAG (10): | 287.41 | |
| VORTEX (21): | 0.8100 | |
| Stochastique (14,3,5): | 23.32 | |
| TEMA (21): | 289.21 | |
| Williams %R (14): | -72.71 | |
| Chande Momentum Oscillator (20): | -3.73 | |
| Repulse (5,40,3): | -1.2700 | |
| ROCnROLL: | 2 | |
| TRIX (15,9): | -0.0800 | |
| Courbe Coppock: | 1.17 |
| MA7: | 294.59 | |
| MA20: | 295.24 | |
| MA50: | 279.13 | |
| MA100: | 258.12 | |
| MAexp7: | 289.39 | |
| MAexp20: | 291.61 | |
| MAexp50: | 294.21 | |
| MAexp100: | 294.23 | |
| Price / MA7: | -2.43% | |
| Price / MA20: | -2.65% | |
| Price / MA50: | +2.97% | |
| Price / MA100: | +11.36% | |
| Price / MAexp7: | -0.68% | |
| Price / MAexp20: | -1.43% | |
| Price / MAexp50: | -2.30% | |
| Price / MAexp100: | -2.31% |
News
Don't forget to follow the news on CUMMINS INC.. At the time of publication of this analysis, the latest news was as follows:
- Cummins Announces Field Testing of Mining Hybrid (Diesel-Battery) Truck Solution
- Cummins Water Works: Watershed Warriors
- Cummins: Valuing the Power of Difference
- The Law Offices of Frank R. Cruz Reminds Investors of Looming Deadline in the Class Action Lawsuit Against Cummins Inc. (CMI)
- Cummins Inc. Deadline Approaching: Kessler Topaz Meltzer & Check, LLP Reminds Investors of Cummins Inc. of Deadline in Securities Fraud Class Action Lawsuit