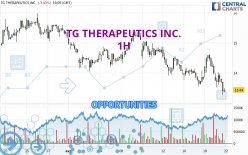
Londinia Opportunities Analyses - 04/19/2024 (GMT) TG THERAPEUTICS INC. - 1H
- U.S. Stocks
- Timeframe : 1H
- - Analysis generated on
- Status : INVALID
Summary of the analysis
Trends
Short term:
Strongly bearish
Underlying:
Strongly bearish
Technical indicators
6%
78%
17%
My opinion
Bearish under 13.55 USD
My targets
13.02 USD (-2.91%)
12.13 USD (-9.55%)
My analysis
The bearish trend is currently very strong for TG THERAPEUTICS INC.. As long as the price remains below the resistance at 13.55 USD, you could try to take advantage of the bearish rally. The first bearish objective is located at 13.02 USD. The bearish momentum would be revived by a break in this support. Sellers would then use the next support located at 12.13 USD as an objective. Crossing it would then enable sellers to target 11.21 USD. Be careful, given the powerful bearish rally underway, excesses could lead to a short-term rebound. If this is the case, remember that trading against the trend may be riskier. It would seem more appropriate to wait for a signal indicating reversal of the trend.
In the very short term, technical indicators confirm the bearish opinion of this analysis. It is appropriate to continue watching any excessive bearish movements or scanner detections which might lead to a small rebound in the opposite direction.
Force
0
10
8.4

Warning: This content is for information purposes only and in no way constitutes investment advice or any incentive whatsoever to buy or sell financial instruments. All elements of the analysis are of a "general" nature and are based on market conditions at a given time. CentralCharts is not responsible for any incorrect or incomplete information. Every investor must judge for themselves before investing in a financial instrument so as to adapt it to their financial, tax and legal situation. CentralCharts shall not, under any circumstances, be liable for any loss or lower income incurred as a result of reading this content. Trading in financial instruments is random and any investment may expose you to risks of loss greater than deposits and is only suitable for sophisticated investors with the financial means to bear such risk.
Additional analysis
Quotes
The TG THERAPEUTICS INC. price is 13.41 USD. The price is lower by -4.15% since the last closing with the lowest point at 13.26 USD and the highest point at 14.02 USD. The deviation from the price is +1.13% for the low point and -4.35% for the high point.13.26
14.02
13.41
A bearish opening was detected by the Central Gaps scanner. Sellers are trying to impose a bearish trend in the very short term.
Bearish opening
Type : Bearish
Timeframe : Openning
A study of price movements over other periods shows the following variations:
Near a new LOW record (1st january)
Type : Bearish
Timeframe : Weekly
New LOW record (1 month)
Type : Bearish
Timeframe : Weekly
Technical
A technical analysis in 1H of this TG THERAPEUTICS INC. chart shows a sharp bearish trend. 92.86% of the signals given by moving averages are bearish. The overall trend is supported by the strong bearish signals from short-term moving averages. There is no crossing of moving average by the price or crossing of moving averages between themselves.
In fact, according to the parameters integrated into the Central Analyzer system, 14 technical indicators out of 18 analysed are currently bearish. Caution: the Central Indicators scanner currently detects an excess:
CCI indicator is oversold : under -100
Type : Neutral
Timeframe : 1 hour
Williams %R indicator is oversold : under -80
Type : Neutral
Timeframe : 1 hour
Pivot points : price is under support 1
Type : Neutral
Timeframe : Weekly
Pivot points : price is under support 3
Type : Neutral
Timeframe : 1 hour
No signals are given by Central Patterns, a market scanner specialised in chart patterns, resistances and supports.
No result was found by the Central Candlesticks scanner on Japanese candlesticks.
ProTrendLines
S3
S2
S1
R1
R2
R3
Price
| S3 | S2 | S1 | Price | R1 | R2 | R3 | |
|---|---|---|---|---|---|---|---|
| ProTrendLines | 6.68 | 8.28 | 11.21 | 13.41 | 13.55 | 14.44 | 14.88 |
| Change (%) | -50.19% | -38.26% | -16.41% | - | +1.04% | +7.68% | +10.96% |
| Change | -6.73 | -5.13 | -2.20 | - | +0.14 | +1.03 | +1.47 |
| Level | Minor | Major | Minor | - | Intermediate | Major | Intermediate |
Attention could also be paid to pivot points to set price objectives:
Daily
| Pivot points | S3 | S2 | S1 | PP | R1 | R2 | R3 |
|---|---|---|---|---|---|---|---|
| Standard | 12.90 | 13.38 | 13.68 | 14.16 | 14.46 | 14.94 | 15.24 |
| Camarilla | 13.78 | 13.85 | 13.92 | 13.99 | 14.06 | 14.13 | 14.21 |
| Woodie | 12.82 | 13.34 | 13.60 | 14.12 | 14.38 | 14.90 | 15.16 |
| Fibonacci | 13.38 | 13.68 | 13.86 | 14.16 | 14.46 | 14.64 | 14.94 |
Weekly
| Pivot points | S3 | S2 | S1 | PP | R1 | R2 | R3 |
|---|---|---|---|---|---|---|---|
| Standard | 12.13 | 13.02 | 13.59 | 14.48 | 15.05 | 15.94 | 16.51 |
| Camarilla | 13.76 | 13.89 | 14.03 | 14.16 | 14.29 | 14.43 | 14.56 |
| Woodie | 11.97 | 12.94 | 13.43 | 14.40 | 14.89 | 15.86 | 16.35 |
| Fibonacci | 13.02 | 13.58 | 13.92 | 14.48 | 15.04 | 15.38 | 15.94 |
Monthly
| Pivot points | S3 | S2 | S1 | PP | R1 | R2 | R3 |
|---|---|---|---|---|---|---|---|
| Standard | 8.96 | 11.74 | 13.47 | 16.25 | 17.98 | 20.76 | 22.49 |
| Camarilla | 13.97 | 14.38 | 14.80 | 15.21 | 15.62 | 16.04 | 16.45 |
| Woodie | 8.45 | 11.48 | 12.96 | 15.99 | 17.47 | 20.50 | 21.98 |
| Fibonacci | 11.74 | 13.46 | 14.52 | 16.25 | 17.97 | 19.03 | 20.76 |
Numerical data
The following is the status of the technical indicators and moving averages at the time of publication of this technical analysis:
Technical indicators
Moving averages
| RSI (14): | 33.17 | |
| MACD (12,26,9): | -0.1400 | |
| Directional Movement: | -16.50 | |
| AROON (14): | -64.29 | |
| DEMA (21): | 13.78 | |
| Parabolic SAR (0,02-0,02-0,2): | 14.45 | |
| Elder Ray (13): | -0.39 | |
| Super Trend (3,10): | 14.33 | |
| Zig ZAG (10): | 13.41 | |
| VORTEX (21): | 0.8700 | |
| Stochastique (14,3,5): | 17.88 | |
| TEMA (21): | 13.75 | |
| Williams %R (14): | -89.78 | |
| Chande Momentum Oscillator (20): | -0.78 | |
| Repulse (5,40,3): | -2.8600 | |
| ROCnROLL: | 2 | |
| TRIX (15,9): | -0.0800 | |
| Courbe Coppock: | 1.86 |
| MA7: | 14.03 | |
| MA20: | 14.65 | |
| MA50: | 15.11 | |
| MA100: | 15.70 | |
| MAexp7: | 13.65 | |
| MAexp20: | 13.94 | |
| MAexp50: | 14.17 | |
| MAexp100: | 14.49 | |
| Price / MA7: | -4.42% | |
| Price / MA20: | -8.46% | |
| Price / MA50: | -11.25% | |
| Price / MA100: | -14.59% | |
| Price / MAexp7: | -1.76% | |
| Price / MAexp20: | -3.80% | |
| Price / MAexp50: | -5.36% | |
| Price / MAexp100: | -7.45% |
Quotes :
-
15 min delayed data
-
Actions NASDAQ
News
The latest news and videos published on TG THERAPEUTICS INC. at the time of the analysis were as follows:
- INVESTOR ACTION NOTICE: The Schall Law Firm Announces it is Investigating Claims Against TG Therapeutics, Inc. and Encourages Investors with Losses In Excess of $100,000 to Contact the Firm
- SHAREHOLDER ALERT: Pomerantz Law Firm Investigates Claims On Behalf of Investors of TG Therapeutics, Inc. - TGTX
- Thinking about buying stock in Nio Inc, Tupperware Brands, ZIM Integrated Shipping, Upstart Holdings, or TG Therapeutics?
- Thinking about buying stock in Virgin Galactic Holdings, TG Therapeutics, Lucid Group, Ainos, or PainReform?
- Thinking about buying stock in Palisade Bio, Kala Pharmaceuticals, F-Star Therapeutics, Nuwellis, or TG Therapeutics?