Londinia Opportunities Analyses - 04/19/2024 (GMT) PARKER-HANNIFIN - 1H
- U.S. Stocks
- Timeframe : 1H
- - Analysis generated on
- Status : INVALID
Summary of the analysis
Additional analysis
Quotes
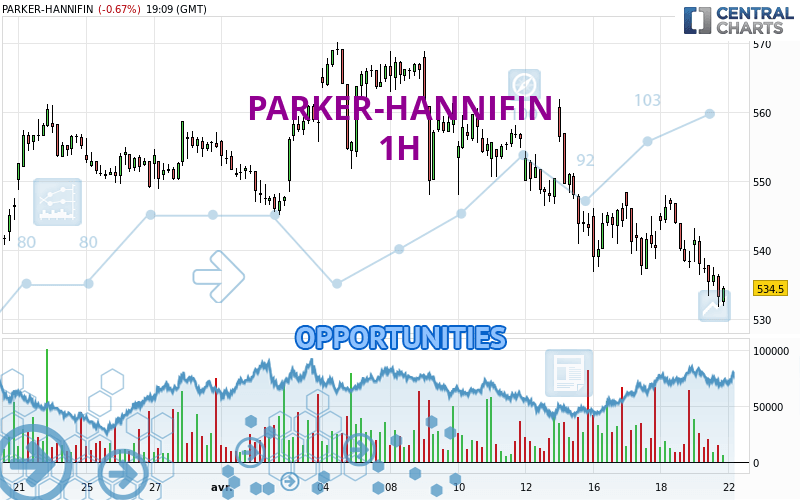
The PARKER-HANNIFIN price is 533.40 USD. The price is lower by -0.87% since the last closing and was traded between 531.78 USD and 543.29 USD over the period. The price is currently at +0.30% from its lowest and -1.82% from its highest.The Central Gaps scanner detects a bullish opening. A small advantage for buyers in the very short term.
Bullish opening
Type : Bullish
Timeframe : Openning
Here is a more detailed summary of the historical variations registered by PARKER-HANNIFIN:
Near a new HIGH record (5 years)
Type : Bullish
Timeframe : Weekly
Near a new HIGH record (1 year)
Type : Bullish
Timeframe : Weekly
Near a new HIGH record (1st january)
Type : Bullish
Timeframe : Weekly
Near a new HIGH record (1 month)
Type : Bullish
Timeframe : Weekly
New LOW record (1 month)
Type : Bearish
Timeframe : Weekly
Technical
Technical analysis of this 1H chart of PARKER-HANNIFIN indicates that the overall trend is strongly bearish. 92.86% of the signals given by moving averages are bearish. The overall trend is supported by the strong bearish signals from short-term moving averages. The Central Indicators market scanner currently does not detect any result that concerns moving averages.
In fact, 14 technical indicators on 18 studied are currently bearish. Caution: the Central Indicators scanner currently detects an excess:
CCI indicator is oversold : under -100
Type : Neutral
Timeframe : 1 hour
Williams %R indicator is oversold : under -80
Type : Neutral
Timeframe : 1 hour
Pivot points : price is under support 1
Type : Neutral
Timeframe : 1 hour
Pivot points : price is under support 3
Type : Neutral
Timeframe : Weekly
The Central Patterns scanner, which studies chart patterns, resistances and supports, has identified this signal:
Near support of channel
Type : Bullish
Timeframe : 1 hour
The Central Candlesticks scanner, specialised in Japanese candlesticks, did not identify any signals.
| S3 | S2 | S1 | Price | R1 | R2 | R3 | |
|---|---|---|---|---|---|---|---|
| ProTrendLines | 462.12 | 528.00 | 531.32 | 533.40 | 536.39 | 540.34 | 547.63 |
| Change (%) | -13.36% | -1.01% | -0.39% | - | +0.56% | +1.30% | +2.67% |
| Change | -71.28 | -5.40 | -2.08 | - | +2.99 | +6.94 | +14.23 |
| Level | Intermediate | Minor | Minor | - | Major | Minor | Major |
Attention could also be paid to pivot points to set price objectives:
| Pivot points | S3 | S2 | S1 | PP | R1 | R2 | R3 |
|---|---|---|---|---|---|---|---|
| Standard | 523.79 | 530.58 | 534.34 | 541.13 | 544.89 | 551.68 | 555.44 |
| Camarilla | 535.19 | 536.16 | 537.12 | 538.09 | 539.06 | 540.02 | 540.99 |
| Woodie | 522.27 | 529.82 | 532.82 | 540.37 | 543.37 | 550.92 | 553.92 |
| Fibonacci | 530.58 | 534.61 | 537.10 | 541.13 | 545.16 | 547.65 | 551.68 |
| Pivot points | S3 | S2 | S1 | PP | R1 | R2 | R3 |
|---|---|---|---|---|---|---|---|
| Standard | 518.99 | 532.68 | 541.50 | 555.19 | 564.01 | 577.70 | 586.52 |
| Camarilla | 544.13 | 546.19 | 548.26 | 550.32 | 552.38 | 554.45 | 556.51 |
| Woodie | 516.56 | 531.46 | 539.07 | 553.97 | 561.58 | 576.48 | 584.09 |
| Fibonacci | 532.68 | 541.28 | 546.59 | 555.19 | 563.79 | 569.10 | 577.70 |
| Pivot points | S3 | S2 | S1 | PP | R1 | R2 | R3 |
|---|---|---|---|---|---|---|---|
| Standard | 499.09 | 512.56 | 534.18 | 547.65 | 569.27 | 582.74 | 604.36 |
| Camarilla | 546.14 | 549.36 | 552.57 | 555.79 | 559.01 | 562.22 | 565.44 |
| Woodie | 503.16 | 514.60 | 538.25 | 549.69 | 573.34 | 584.78 | 608.43 |
| Fibonacci | 512.56 | 525.97 | 534.25 | 547.65 | 561.06 | 569.34 | 582.74 |
Numerical data
The following are the details of the technical indicators and moving averages that were collected to generate this technical analysis:
| RSI (14): | 34.09 | |
| MACD (12,26,9): | -3.0500 | |
| Directional Movement: | -18.73 | |
| AROON (14): | -78.57 | |
| DEMA (21): | 536.21 | |
| Parabolic SAR (0,02-0,02-0,2): | 541.77 | |
| Elder Ray (13): | -4.21 | |
| Super Trend (3,10): | 546.29 | |
| Zig ZAG (10): | 532.08 | |
| VORTEX (21): | 0.8500 | |
| Stochastique (14,3,5): | 11.65 | |
| TEMA (21): | 535.70 | |
| Williams %R (14): | -90.57 | |
| Chande Momentum Oscillator (20): | -10.96 | |
| Repulse (5,40,3): | -0.9400 | |
| ROCnROLL: | 2 | |
| TRIX (15,9): | -0.0600 | |
| Courbe Coppock: | 1.97 |
| MA7: | 543.64 | |
| MA20: | 551.76 | |
| MA50: | 539.52 | |
| MA100: | 498.85 | |
| MAexp7: | 536.78 | |
| MAexp20: | 539.94 | |
| MAexp50: | 544.99 | |
| MAexp100: | 548.24 | |
| Price / MA7: | -1.88% | |
| Price / MA20: | -3.33% | |
| Price / MA50: | -1.13% | |
| Price / MA100: | +6.93% | |
| Price / MAexp7: | -0.63% | |
| Price / MAexp20: | -1.21% | |
| Price / MAexp50: | -2.13% | |
| Price / MAexp100: | -2.71% |
News
Don't forget to follow the news on PARKER-HANNIFIN. At the time of publication of this analysis, the latest news was as follows:
- Parker Reports Fiscal 2017 Second Quarter Results
- Parker Acquires Helac Corporation
- Parker Increases Quarterly Cash Dividend 5% to 66 Cents per Share
- Parker to Announce Fiscal 2017 Second Quarter Earnings on February 2; Conference Call and Webcast Scheduled for 11 a.m. Eastern
- Parker to Acquire Filtration Company CLARCOR in a Strategic Portfolio Transaction