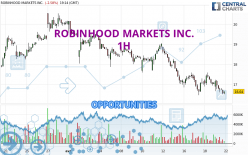
Londinia Opportunities Analyses - 04/19/2024 (GMT) ROBINHOOD MARKETS INC. - 1H
- U.S. Stocks
- Timeframe : 1H
- - Analysis generated on
- Status : INVALID
Summary of the analysis
Trends
Short term:
Strongly bearish
Underlying:
Strongly bearish
Technical indicators
17%
78%
6%
My opinion
Bearish under 16.70 USD
My targets
16.19 USD (-2.18%)
15.83 USD (-4.35%)
My analysis
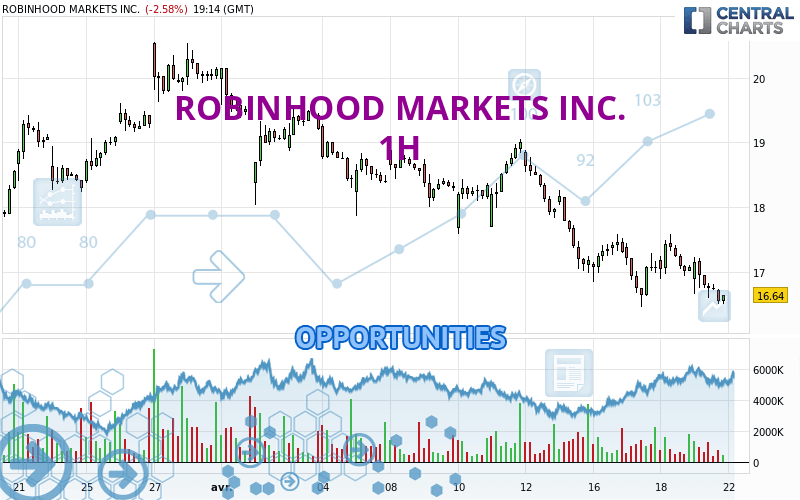
ROBINHOOD MARKETS INC. is part of a very strong bearish trend. Traders may consider trading only short positions (for sale) as long as the price remains well below 16.70 USD. The next support located at 16.19 USD is the next bearish objective to target. A bearish break of this support would revive the bearish momentum. The bearish movement could then continue towards the next support located at 15.83 USD. Below this support, sellers could then target 13.21 USD. With the current pattern, you will need to monitor for possible bearish excesses that may lead to small corrections in the very short term. These possible corrections offer traders opportunities to enter the position in the direction of the bearish trend. Trying to profit from the purchase of these possible corrections may seem risky.
Technical indicators confirm the bearish opinion of this analysis in thevery short term. However, be careful of excessive bearish movements. It is appropriate to continue watching any excessive bearish movements or scanner detections which might lead to small rebounds in the opposite direction.
Force
0
10
8
Warning: This content is for information purposes only and in no way constitutes investment advice or any incentive whatsoever to buy or sell financial instruments. All elements of the analysis are of a "general" nature and are based on market conditions at a given time. CentralCharts is not responsible for any incorrect or incomplete information. Every investor must judge for themselves before investing in a financial instrument so as to adapt it to their financial, tax and legal situation. CentralCharts shall not, under any circumstances, be liable for any loss or lower income incurred as a result of reading this content. Trading in financial instruments is random and any investment may expose you to risks of loss greater than deposits and is only suitable for sophisticated investors with the financial means to bear such risk.
Additional analysis
Quotes
ROBINHOOD MARKETS INC. rating 16.55 USD. The price registered a decrease of -3.10% on the session and was between 16.50 USD and 17.23 USD. This implies that the price is at +0.30% from its lowest and at -3.95% from its highest.16.50
17.23
16.55
A bearish opening was detected by the Central Gaps scanner. Sellers are trying to impose a bearish trend in the very short term.
Bearish opening
Type : Bearish
Timeframe : Openning
Here is a more detailed summary of the historical variations registered by ROBINHOOD MARKETS INC.:
Near a new LOW record (1 month)
Type : Bearish
Timeframe : Weekly
Technical
A technical analysis in 1H of this ROBINHOOD MARKETS INC. chart shows a sharp bearish trend. The signals given by moving averages are 92.86% bearish. This strong bearish trend is confirmed by the strong signals currently being given by short-term moving averages. The Central Indicators scanner does not detect any result on moving averages that would impact this trend.
In fact, 14 technical indicators on 18 studied are currently positioned bearish. But beware of excesses. The Central Indicators scanner currently detects this:
CCI indicator is oversold : under -100
Type : Neutral
Timeframe : 1 hour
Williams %R indicator is oversold : under -80
Type : Neutral
Timeframe : 1 hour
Pivot points : price is under support 1
Type : Neutral
Timeframe : 1 hour
Pivot points : price is under support 3
Type : Neutral
Timeframe : Weekly
The Central Patterns scanner, which studies chart patterns, resistances and supports, has identified these signals:
Near support of channel
Type : Bullish
Timeframe : 1 hour
Near support of triangle
Type : Bullish
Timeframe : 1 hour
No result was found by the Central Candlesticks scanner on Japanese candlesticks.
ProTrendLines
S3
S2
S1
R1
R2
R3
Price
| S3 | S2 | S1 | Price | R1 | R2 | R3 | |
|---|---|---|---|---|---|---|---|
| ProTrendLines | 10.59 | 13.21 | 16.19 | 16.55 | 16.70 | 17.24 | 17.59 |
| Change (%) | -36.01% | -20.18% | -2.18% | - | +0.91% | +4.17% | +6.28% |
| Change | -5.96 | -3.34 | -0.36 | - | +0.15 | +0.69 | +1.04 |
| Level | Intermediate | Major | Intermediate | - | Major | Intermediate | Intermediate |
To determine price objectives, it is also possible to use the pivot points. Here is the price position in relation to pivot points:
Daily
| Pivot points | S3 | S2 | S1 | PP | R1 | R2 | R3 |
|---|---|---|---|---|---|---|---|
| Standard | 16.08 | 16.49 | 16.78 | 17.19 | 17.48 | 17.89 | 18.18 |
| Camarilla | 16.89 | 16.95 | 17.02 | 17.08 | 17.14 | 17.21 | 17.27 |
| Woodie | 16.03 | 16.46 | 16.73 | 17.16 | 17.43 | 17.86 | 18.13 |
| Fibonacci | 16.49 | 16.75 | 16.92 | 17.19 | 17.45 | 17.62 | 17.89 |
Weekly
| Pivot points | S3 | S2 | S1 | PP | R1 | R2 | R3 |
|---|---|---|---|---|---|---|---|
| Standard | 15.83 | 16.71 | 17.34 | 18.22 | 18.85 | 19.73 | 20.36 |
| Camarilla | 17.56 | 17.69 | 17.83 | 17.97 | 18.11 | 18.25 | 18.39 |
| Woodie | 15.71 | 16.65 | 17.22 | 18.16 | 18.73 | 19.67 | 20.24 |
| Fibonacci | 16.71 | 17.29 | 17.64 | 18.22 | 18.80 | 19.15 | 19.73 |
Monthly
| Pivot points | S3 | S2 | S1 | PP | R1 | R2 | R3 |
|---|---|---|---|---|---|---|---|
| Standard | 12.12 | 13.89 | 17.01 | 18.78 | 21.90 | 23.67 | 26.79 |
| Camarilla | 18.79 | 19.23 | 19.68 | 20.13 | 20.58 | 21.03 | 21.48 |
| Woodie | 12.80 | 14.23 | 17.69 | 19.12 | 22.58 | 24.01 | 27.47 |
| Fibonacci | 13.89 | 15.76 | 16.91 | 18.78 | 20.65 | 21.80 | 23.67 |
Numerical data
The following is the status of the technical indicators and moving averages at the time of publication of this technical analysis:
Technical indicators
Moving averages
| RSI (14): | 31.51 | |
| MACD (12,26,9): | -0.2100 | |
| Directional Movement: | -23.23 | |
| AROON (14): | -71.43 | |
| DEMA (21): | 16.75 | |
| Parabolic SAR (0,02-0,02-0,2): | 17.46 | |
| Elder Ray (13): | -0.31 | |
| Super Trend (3,10): | 17.42 | |
| Zig ZAG (10): | 16.53 | |
| VORTEX (21): | 0.8600 | |
| Stochastique (14,3,5): | 10.85 | |
| TEMA (21): | 16.75 | |
| Williams %R (14): | -96.31 | |
| Chande Momentum Oscillator (20): | -0.50 | |
| Repulse (5,40,3): | -1.7200 | |
| ROCnROLL: | 2 | |
| TRIX (15,9): | -0.1600 | |
| Courbe Coppock: | 2.49 |
| MA7: | 17.45 | |
| MA20: | 18.44 | |
| MA50: | 16.71 | |
| MA100: | 14.01 | |
| MAexp7: | 16.74 | |
| MAexp20: | 17.03 | |
| MAexp50: | 17.46 | |
| MAexp100: | 17.85 | |
| Price / MA7: | -5.16% | |
| Price / MA20: | -10.25% | |
| Price / MA50: | -0.96% | |
| Price / MA100: | +18.13% | |
| Price / MAexp7: | -1.14% | |
| Price / MAexp20: | -2.82% | |
| Price / MAexp50: | -5.21% | |
| Price / MAexp100: | -7.28% |
Quotes :
-
15 min delayed data
-
Actions NASDAQ
News
The latest news and videos published on ROBINHOOD MARKETS INC. at the time of the analysis were as follows:
- Robinhood Markets, Inc. to Announce First Quarter 2024 Results on May 8, 2024
- Robinhood Markets, Inc. Co-Founder Baiju Bhatt To Step Down as Chief Creative Officer