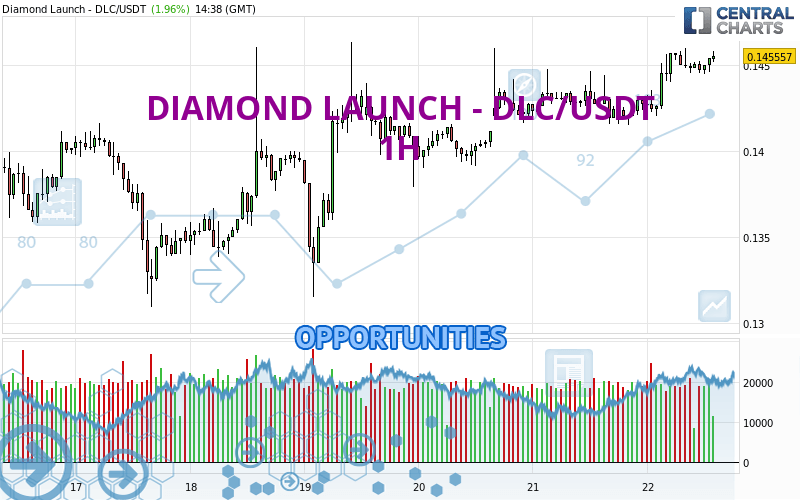
Londinia Opportunities Analyses - 04/22/2024 (GMT) DIAMOND LAUNCH - DLC/USDT - 1H
| Type: | Cryptocurrencies |
| Ticker: | DLCUSDT |
| ISIN: |
I am pleased to note that the threshold for invalidation has been maintained for 20 Candlesticks.
- Cryptocurrencies
- Timeframe : 1H
- - Analysis generated on
- Status : LEVEL MAINTAINED
Summary of the analysis
Trends
Short term:
Strongly bullish
Underlying:
Strongly bullish
Technical indicators
83%
0%
17%
My opinion
Bullish above 0.143348 USDT
My targets
0.149247 USDT (+2.52%)
0.157154 USDT (+7.95%)
My analysis
DIAMOND LAUNCH - DLC/USDT is part of a very strong bullish trend. Traders may consider trading only long positions (at the time of purchase) as long as the price remains well above 0.143348 USDT. The next resistance located at 0.149247 USDT is the next bullish objective to be reached. A bullish break in this resistance would boost the bullish momentum. The bullish movement could then continue towards the next resistance located at 0.157154 USDT. After this resistance, buyers could then target 0.203102 USDT. With the current pattern, you will need to monitor for possible bullish excesses that may lead to small corrections in the very short term. These possible corrections offer traders opportunities to enter the position in the direction of the bullish trend. Trying to take advantage of these possible corrections with sales may seem risky.
In the very short term, the general bullish sentiment is confirmed by technical indicators. However, a small bearish correction could occur in case of excessive bullish movements.
Force
0
10
8.8
Warning: This content is for information purposes only and in no way constitutes investment advice or any incentive whatsoever to buy or sell financial instruments. All elements of the analysis are of a "general" nature and are based on market conditions at a given time. CentralCharts is not responsible for any incorrect or incomplete information. Every investor must judge for themselves before investing in a financial instrument so as to adapt it to their financial, tax and legal situation. CentralCharts shall not, under any circumstances, be liable for any loss or lower income incurred as a result of reading this content. Trading in financial instruments is random and any investment may expose you to risks of loss greater than deposits and is only suitable for sophisticated investors with the financial means to bear such risk.
Additional analysis
Quotes
DIAMOND LAUNCH - DLC/USDT rating 0.145581 USDT. The price has increased by +1.98% since the last closing with the lowest point at 0.142057 USDT and the highest point at 0.145986 USDT. The deviation from the price is +2.48% for the low point and -0.28% for the high point.0.142057
0.145986
0.145581
A bearish opening was detected by the Central Gaps scanner. Sellers are trying to impose a bearish trend in the very short term.
Bearish opening
Type : Bearish
Timeframe : Openning
A study of price movements over other periods shows the following variations:
Technical
A technical analysis in 1H of this DIAMOND LAUNCH - DLC/USDT chart shows a strongly bullish trend. 92.86% of the signals given by moving averages are bullish. The overall trend is supported by the strong bullish signals from short-term moving averages. The Central Indicators market scanner currently does not detect any result that concerns moving averages.
In fact, 15 technical indicators on 18 studied are currently positioned bullish. Caution: the Central Indicators scanner currently detects an excess:
Williams %R indicator is overbought : over -20
Type : Neutral
Timeframe : 1 hour
Pivot points : price is over resistance 1
Type : Neutral
Timeframe : 1 hour
Central Patterns, the market scanner focusing on chart patterns, resistances and supports found this result:
Resistance of channel is broken
Type : Bullish
Timeframe : 1 hour
The presence of a bullish Japanese candlestick pattern detected by Central Candlesticks that could cause a very short term rebound was also detected:
Three white soldiers
Type : Bullish
Timeframe : 1 hour
ProTrendLines
S3
S2
S1
R1
R2
R3
Price
| S3 | S2 | S1 | Price | R1 | R2 | R3 | |
|---|---|---|---|---|---|---|---|
| ProTrendLines | 0.133858 | 0.136257 | 0.143348 | 0.145581 | 0.146245 | 0.149247 | 0.157154 |
| Change (%) | -8.05% | -6.40% | -1.53% | - | +0.46% | +2.52% | +7.95% |
| Change | -0.011723 | -0.009324 | -0.002233 | - | +0.000664 | +0.003666 | +0.011573 |
| Level | Minor | Intermediate | Intermediate | - | Intermediate | Minor | Major |
Pivot points can also be used to set your price objectives. Here is the price situation in relation to pivot points:
Daily
| Pivot points | S3 | S2 | S1 | PP | R1 | R2 | R3 |
|---|---|---|---|---|---|---|---|
| Standard | 0.138011 | 0.139772 | 0.141263 | 0.143024 | 0.144515 | 0.146276 | 0.147767 |
| Camarilla | 0.141860 | 0.142158 | 0.142456 | 0.142754 | 0.143052 | 0.143350 | 0.143648 |
| Woodie | 0.137876 | 0.139705 | 0.141128 | 0.142957 | 0.144380 | 0.146209 | 0.147632 |
| Fibonacci | 0.139772 | 0.141014 | 0.141782 | 0.143024 | 0.144266 | 0.145034 | 0.146276 |
Weekly
| Pivot points | S3 | S2 | S1 | PP | R1 | R2 | R3 |
|---|---|---|---|---|---|---|---|
| Standard | 0.117727 | 0.124342 | 0.133557 | 0.140172 | 0.149387 | 0.156002 | 0.165217 |
| Camarilla | 0.138419 | 0.139870 | 0.141321 | 0.142772 | 0.144223 | 0.145674 | 0.147125 |
| Woodie | 0.119027 | 0.124992 | 0.134857 | 0.140822 | 0.150687 | 0.156652 | 0.166517 |
| Fibonacci | 0.124342 | 0.130389 | 0.134125 | 0.140172 | 0.146219 | 0.149955 | 0.156002 |
Monthly
| Pivot points | S3 | S2 | S1 | PP | R1 | R2 | R3 |
|---|---|---|---|---|---|---|---|
| Standard | 0.092977 | 0.110628 | 0.133749 | 0.151400 | 0.174521 | 0.192172 | 0.215293 |
| Camarilla | 0.145657 | 0.149394 | 0.153132 | 0.156869 | 0.160606 | 0.164344 | 0.168081 |
| Woodie | 0.095711 | 0.111996 | 0.136483 | 0.152768 | 0.177255 | 0.193540 | 0.218027 |
| Fibonacci | 0.110628 | 0.126203 | 0.135825 | 0.151400 | 0.166975 | 0.176597 | 0.192172 |
Numerical data
The following is the status of technical indicators and moving averages registered at the time this technical analysis was created:
Technical indicators
Moving averages
| RSI (14): | 65.38 | |
| MACD (12,26,9): | 0.0007 | |
| Directional Movement: | 13.550002 | |
| AROON (14): | 42.857143 | |
| DEMA (21): | 0.145245 | |
| Parabolic SAR (0,02-0,02-0,2): | 0.142763 | |
| Elder Ray (13): | 0.000640 | |
| Super Trend (3,10): | 0.142875 | |
| Zig ZAG (10): | 0.145392 | |
| VORTEX (21): | 1.1740 | |
| Stochastique (14,3,5): | 82.68 | |
| TEMA (21): | 0.145520 | |
| Williams %R (14): | -13.16 | |
| Chande Momentum Oscillator (20): | 0.002864 | |
| Repulse (5,40,3): | 0.5648 | |
| ROCnROLL: | 1 | |
| TRIX (15,9): | 0.0636 | |
| Courbe Coppock: | 3.40 |
| MA7: | 0.140826 | |
| MA20: | 0.146192 | |
| MA50: | 0.148216 | |
| MA100: | 0.127322 | |
| MAexp7: | 0.145121 | |
| MAexp20: | 0.144340 | |
| MAexp50: | 0.143191 | |
| MAexp100: | 0.142166 | |
| Price / MA7: | +3.38% | |
| Price / MA20: | -0.42% | |
| Price / MA50: | -1.78% | |
| Price / MA100: | +14.34% | |
| Price / MAexp7: | +0.32% | |
| Price / MAexp20: | +0.86% | |
| Price / MAexp50: | +1.67% | |
| Price / MAexp100: | +2.40% |
Quotes :
-
Real time data
-
Cryptocompare