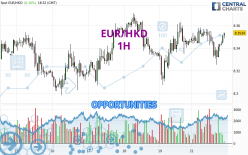
Londinia Opportunities Analyses - 04/22/2024 (GMT) EUR/HKD - 1H
- FX/Indices
- Timeframe : 1H
- - Analysis generated on
- Status : TARGET REACHED
Summary of the analysis

Additional analysis
Quotes
EUR/HKD rating 8.3535 HKD. The price registered an increase of +0.10% on the session and was traded between 8.3251 HKD and 8.3583 HKD over the period. The price is currently at +0.34% from its lowest and -0.06% from its highest.A bullish opening was detected by the Central Gaps scanner. Buyers are trying to impose a bullish momentum in the very short term.
Bullish opening
Type : Bullish
Timeframe : Openning
Here is a more detailed summary of the historical variations registered by EUR/HKD:
Near a new LOW record (1 year)
Type : Bearish
Timeframe : Weekly
Near a new HIGH record (1st january)
Type : Bullish
Timeframe : Weekly
Near a new HIGH record (1 month)
Type : Bullish
Timeframe : Weekly
Technical
Technical analysis of EUR/HKD in 1H shows a strongly overall bullish trend. 85.71% of the signals given by moving averages are bullish. This strongly bullish trend is supported by the strong bullish signals given by short-term moving averages. An assessment of moving averages reveals several bullish signals that could impact this trend:
Bullish trend reversal : Moving Average 20
Type : Bullish
Timeframe : 1 hour
Bullish trend reversal : Moving Average 50
Type : Bullish
Timeframe : 1 hour
Bullish trend reversal : adaptative moving average 20
Type : Bullish
Timeframe : 1 hour
Bullish trend reversal : adaptative moving average 50
Type : Bullish
Timeframe : 1 hour
Bullish trend reversal : adaptative moving average 100
Type : Bullish
Timeframe : 1 hour
In fact, according to the parameters integrated into the Central Analyzer system, 12 technical indicators out of 18 analysed are currently bullish. Caution: the Central Indicators scanner currently detects an excess:
Williams %R indicator is overbought : over -20
Type : Neutral
Timeframe : 1 hour
MACD crosses UP its Moving Average
Type : Bullish
Timeframe : 1 hour
MACD indicator is back over 0
Type : Bullish
Timeframe : 1 hour
An analysis of the price chart with the Central Patterns scanner (detector of chart patterns and resistances and supports) shows several results that can have an impact on the price change:
Near resistance of channel
Type : Bearish
Timeframe : 1 hour
Near resistance of triangle
Type : Bearish
Timeframe : 1 hour
The Central Candlesticks scanner currently notes the presence of this pattern in Japanese candlesticks that could mark the end of the short-term trend currently underway:
Doji
Type : Neutral
Timeframe : 1 hour
| S3 | S2 | S1 | Price | R1 | R2 | R3 | |
|---|---|---|---|---|---|---|---|
| ProTrendLines | 8.3072 | 8.3272 | 8.3436 | 8.3535 | 8.3711 | 8.4024 | 8.4273 |
| Change (%) | -0.55% | -0.31% | -0.12% | - | +0.21% | +0.59% | +0.88% |
| Change | -0.0463 | -0.0263 | -0.0099 | - | +0.0176 | +0.0489 | +0.0738 |
| Level | Major | Intermediate | Minor | - | Intermediate | Major | Minor |
To determine price objectives, it is also possible to use the pivot points. Here is the price position in relation to pivot points:
| Pivot points | S3 | S2 | S1 | PP | R1 | R2 | R3 |
|---|---|---|---|---|---|---|---|
| Standard | 8.2579 | 8.2826 | 8.3139 | 8.3386 | 8.3699 | 8.3946 | 8.4259 |
| Camarilla | 8.3298 | 8.3349 | 8.3401 | 8.3452 | 8.3503 | 8.3555 | 8.3606 |
| Woodie | 8.2612 | 8.2843 | 8.3172 | 8.3403 | 8.3732 | 8.3963 | 8.4292 |
| Fibonacci | 8.2826 | 8.3040 | 8.3172 | 8.3386 | 8.3600 | 8.3732 | 8.3946 |
| Pivot points | S3 | S2 | S1 | PP | R1 | R2 | R3 |
|---|---|---|---|---|---|---|---|
| Standard | 8.2325 | 8.2654 | 8.3053 | 8.3382 | 8.3781 | 8.4110 | 8.4509 |
| Camarilla | 8.3252 | 8.3319 | 8.3385 | 8.3452 | 8.3519 | 8.3586 | 8.3652 |
| Woodie | 8.2360 | 8.2672 | 8.3088 | 8.3400 | 8.3816 | 8.4128 | 8.4544 |
| Fibonacci | 8.2654 | 8.2932 | 8.3104 | 8.3382 | 8.3660 | 8.3832 | 8.4110 |
| Pivot points | S3 | S2 | S1 | PP | R1 | R2 | R3 |
|---|---|---|---|---|---|---|---|
| Standard | 8.2223 | 8.3244 | 8.3825 | 8.4846 | 8.5427 | 8.6448 | 8.7029 |
| Camarilla | 8.3965 | 8.4111 | 8.4258 | 8.4405 | 8.4552 | 8.4699 | 8.4846 |
| Woodie | 8.2002 | 8.3134 | 8.3604 | 8.4736 | 8.5206 | 8.6338 | 8.6808 |
| Fibonacci | 8.3244 | 8.3856 | 8.4234 | 8.4846 | 8.5458 | 8.5836 | 8.6448 |
Numerical data
The following is the status of technical indicators and moving averages registered at the time this technical analysis was created:
| RSI (14): | 56.80 | |
| MACD (12,26,9): | 0.0001 | |
| Directional Movement: | -0.1879 | |
| AROON (14): | -50.0000 | |
| DEMA (21): | 8.3459 | |
| Parabolic SAR (0,02-0,02-0,2): | 8.3256 | |
| Elder Ray (13): | 0.0049 | |
| Super Trend (3,10): | 8.3316 | |
| Zig ZAG (10): | 8.3527 | |
| VORTEX (21): | 1.0278 | |
| Stochastique (14,3,5): | 74.35 | |
| TEMA (21): | 8.3451 | |
| Williams %R (14): | -16.51 | |
| Chande Momentum Oscillator (20): | -0.0023 | |
| Repulse (5,40,3): | 0.1196 | |
| ROCnROLL: | 1 | |
| TRIX (15,9): | -0.0003 | |
| Courbe Coppock: | 0.17 |
| MA7: | 8.3374 | |
| MA20: | 8.4150 | |
| MA50: | 8.4580 | |
| MA100: | 8.4830 | |
| MAexp7: | 8.3462 | |
| MAexp20: | 8.3458 | |
| MAexp50: | 8.3449 | |
| MAexp100: | 8.3475 | |
| Price / MA7: | +0.19% | |
| Price / MA20: | -0.73% | |
| Price / MA50: | -1.24% | |
| Price / MA100: | -1.53% | |
| Price / MAexp7: | +0.09% | |
| Price / MAexp20: | +0.09% | |
| Price / MAexp50: | +0.10% | |
| Price / MAexp100: | +0.07% |