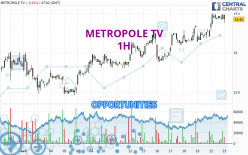
Londinia Opportunities Analyses - 04/23/2024 (GMT) METROPOLE TV - 1H
-
EUR
(-)
-
15 min delayed data - Euronext Paris
| Type: | Stocks |
| Ticker: | MMT |
| ISIN: | FR0000053225 |
I am pleased to note that the threshold for invalidation has been maintained for 20 Candlesticks.
- Europe Stocks
- Timeframe : 1H
- - Analysis generated on
- Status : LEVEL MAINTAINED
Summary of the analysis
Trends
Short term:
Strongly bullish
Underlying:
Strongly bullish
Technical indicators
78%
0%
22%
My opinion
Bullish above 14.18 EUR
My targets
14.82 EUR (+2.35%)
14.86 EUR (+2.62%)
My analysis
METROPOLE TV is part of a very strong bullish trend. Traders may consider trading only long positions (at the time of purchase) as long as the price remains well above 14.18 EUR. The next resistance located at 14.82 EUR is the next bullish objective to be reached. A bullish break in this resistance would boost the bullish momentum. The bullish movement could then continue towards the next resistance located at 14.86 EUR. After this resistance, buyers could then target 16.04 EUR. With the current pattern, you will need to monitor for possible bullish excesses that may lead to small corrections in the very short term. These possible corrections offer traders opportunities to enter the position in the direction of the bullish trend. Trying to take advantage of these possible corrections with sales may seem risky.
In the very short term, the general bullish sentiment is confirmed by technical indicators. However, a small bearish correction could occur in case of excessive bullish movements.
Force
0
10
8.6

Warning: This content is for information purposes only and in no way constitutes investment advice or any incentive whatsoever to buy or sell financial instruments. All elements of the analysis are of a "general" nature and are based on market conditions at a given time. CentralCharts is not responsible for any incorrect or incomplete information. Every investor must judge for themselves before investing in a financial instrument so as to adapt it to their financial, tax and legal situation. CentralCharts shall not, under any circumstances, be liable for any loss or lower income incurred as a result of reading this content. Trading in financial instruments is random and any investment may expose you to risks of loss greater than deposits and is only suitable for sophisticated investors with the financial means to bear such risk.
Additional analysis
Quotes
The METROPOLE TV price is 14.48 EUR. The price has increased by +0.00% since the last closing with the lowest point at 14.48 EUR and the highest point at 14.48 EUR. The deviation from the price is 0% for the low point and 0% for the high point.14.48
14.48
14.48
The Central Gaps scanner detects the formation of a bullish gap marking the strong presence of buyers against sellers at the opening. This formed a quotation gap.
Opening Gap UP
Type : Bullish
Timeframe : Openning
Here is a more detailed summary of the historical variations registered by METROPOLE TV:
New HIGH record (1 year)
Type : Bullish
Timeframe : Weekly
New HIGH record (1st january)
Type : Bullish
Timeframe : Weekly
New HIGH record (1 month)
Type : Bullish
Timeframe : Weekly
The Central Volumes scanner detects abnormal volumes on the asset:
Abnormal volumes
Timeframe : 20 days
Technical
A technical analysis in 1H of this METROPOLE TV chart shows a strongly bullish trend. The signals given by the moving averages are 92.86% bullish. This strong bullish trend is confirmed by the strong signals currently being given by short-term moving averages. There is no crossing of moving average by the price or crossing of moving averages between themselves.
In fact, 14 technical indicators on 18 studied are currently positioned bullish. Caution: the Central Indicators scanner currently detects an excess:
Williams %R indicator is overbought : over -20
Type : Neutral
Timeframe : 1 hour
Pivot points : price is over resistance 1
Type : Neutral
Timeframe : Weekly
Pivot points : price is over resistance 3
Type : Neutral
Timeframe : 1 hour
The Central Patterns scanner, which studies chart patterns, resistances and supports, has identified this signal:
Near horizontal resistance
Type : Bearish
Timeframe : 1 hour
The Central Candlesticks scanner which studies Japanese candlesticks did not detect anything.
ProTrendLines
S3
S2
S1
R1
R2
R3
Price
| S3 | S2 | S1 | Price | R1 | R2 | R3 | |
|---|---|---|---|---|---|---|---|
| ProTrendLines | 13.80 | 13.95 | 14.18 | 14.48 | 14.50 | 14.82 | 16.04 |
| Change (%) | -4.70% | -3.66% | -2.07% | - | +0.14% | +2.35% | +10.77% |
| Change | -0.68 | -0.53 | -0.30 | - | +0.02 | +0.34 | +1.56 |
| Level | Minor | Intermediate | Minor | - | Intermediate | Intermediate | Intermediate |
To determine price objectives, it is also possible to use the pivot points. Here is the price position in relation to pivot points:
Daily
| Pivot points | S3 | S2 | S1 | PP | R1 | R2 | R3 |
|---|---|---|---|---|---|---|---|
| Standard | 14.12 | 14.20 | 14.34 | 14.42 | 14.56 | 14.64 | 14.78 |
| Camarilla | 14.42 | 14.44 | 14.46 | 14.48 | 14.50 | 14.52 | 14.54 |
| Woodie | 14.15 | 14.22 | 14.37 | 14.44 | 14.59 | 14.66 | 14.81 |
| Fibonacci | 14.20 | 14.28 | 14.34 | 14.42 | 14.50 | 14.56 | 14.64 |
Weekly
| Pivot points | S3 | S2 | S1 | PP | R1 | R2 | R3 |
|---|---|---|---|---|---|---|---|
| Standard | 13.48 | 13.68 | 13.94 | 14.14 | 14.40 | 14.60 | 14.86 |
| Camarilla | 14.07 | 14.12 | 14.16 | 14.20 | 14.24 | 14.28 | 14.33 |
| Woodie | 13.51 | 13.70 | 13.97 | 14.16 | 14.43 | 14.62 | 14.89 |
| Fibonacci | 13.68 | 13.86 | 13.96 | 14.14 | 14.32 | 14.42 | 14.60 |
Monthly
| Pivot points | S3 | S2 | S1 | PP | R1 | R2 | R3 |
|---|---|---|---|---|---|---|---|
| Standard | 11.38 | 11.95 | 12.88 | 13.45 | 14.38 | 14.95 | 15.88 |
| Camarilla | 13.41 | 13.55 | 13.68 | 13.82 | 13.96 | 14.10 | 14.23 |
| Woodie | 11.57 | 12.04 | 13.07 | 13.54 | 14.57 | 15.04 | 16.07 |
| Fibonacci | 11.95 | 12.52 | 12.87 | 13.45 | 14.02 | 14.37 | 14.95 |
Numerical data
The following is the status of the technical indicators and moving averages at the time of publication of this technical analysis:
Technical indicators
Moving averages
| RSI (14): | 66.11 | |
| MACD (12,26,9): | 0.0800 | |
| Directional Movement: | 19.19 | |
| AROON (14): | 42.86 | |
| DEMA (21): | 14.45 | |
| Parabolic SAR (0,02-0,02-0,2): | 14.38 | |
| Elder Ray (13): | 0.06 | |
| Super Trend (3,10): | 14.26 | |
| Zig ZAG (10): | 14.48 | |
| VORTEX (21): | 1.1500 | |
| Stochastique (14,3,5): | 83.70 | |
| TEMA (21): | 14.48 | |
| Williams %R (14): | -6.25 | |
| Chande Momentum Oscillator (20): | 0.26 | |
| Repulse (5,40,3): | 0.3400 | |
| ROCnROLL: | 1 | |
| TRIX (15,9): | 0.0700 | |
| Courbe Coppock: | 2.98 |
| MA7: | 14.20 | |
| MA20: | 13.90 | |
| MA50: | 13.17 | |
| MA100: | 12.97 | |
| MAexp7: | 14.44 | |
| MAexp20: | 14.34 | |
| MAexp50: | 14.22 | |
| MAexp100: | 14.06 | |
| Price / MA7: | +1.97% | |
| Price / MA20: | +4.17% | |
| Price / MA50: | +9.95% | |
| Price / MA100: | +11.64% | |
| Price / MAexp7: | +0.28% | |
| Price / MAexp20: | +0.98% | |
| Price / MAexp50: | +1.83% | |
| Price / MAexp100: | +2.99% |
Quotes :
-
15 min delayed data
-
Euronext Paris
News
The last news published on METROPOLE TV at the time of the generation of this analysis was as follows:
- M6 Metropole Television: Consolidated Results at 30 June 2023
- M6 METROPOLE TELEVISION: FORMALITIES FOR OBTAINING THE FIRST HALF-YEAR 2023 FINANCIAL REPORT (30 JUNE 2023)
- M6 METROPOLE TELEVISION: Disposal of CTZAR to the Group The Independents
- Arcom Decision: M6 Allowed to Continue Broadcasting on DTT for 10 Years
- M6 Metropole Television: First Quarter 2023