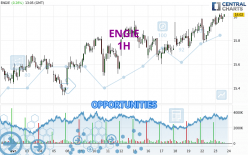
Londinia Opportunities Analyses - 04/23/2024 (GMT) ENGIE - 1H
-
EUR
(-)
-
15 min delayed data - Euronext Paris
| Type: | Stocks |
| Ticker: | ENGI |
| ISIN: | FR0010208488 |
I am pleased to note that the threshold for invalidation has been maintained for 20 Candlesticks.
- Europe Stocks
- Timeframe : 1H
- - Analysis generated on
- Status : LEVEL MAINTAINED
Summary of the analysis
Trends
Short term:
Strongly bullish
Underlying:
Strongly bullish
Technical indicators
94%
0%
6%
My opinion
Bullish above 15.880 EUR
My targets
16.260 EUR (+1.59%)
16.550 EUR (+3.41%)
My analysis
The bullish trend is currently very strong on ENGIE. As long as the price remains above the support at 15.880 EUR, you could try to benefit from the boom. The first bullish objective is located at 16.260 EUR. The bullish momentum would be boosted by a break in this resistance. Buyers would then use the next resistance located at 16.550 EUR as an objective. Crossing it would then enable buyers to target 17.924 EUR. Be careful, given the powerful bullish rally underway, excesses could lead to a possible correction in the short term. If this is the case, remember that trading against the trend may be riskier. It would seem more appropriate to wait for a signal indicating reversal of the trend.
Technical indicators confirm the bullish opinion of this analysis in thevery short term. However, be careful of excessive bullish movements. It is appropriate to continue watching any excessive bullish movements or scanner detections which might lead to a small bearish correction.
Force
0
10
9.1

Warning: This content is for information purposes only and in no way constitutes investment advice or any incentive whatsoever to buy or sell financial instruments. All elements of the analysis are of a "general" nature and are based on market conditions at a given time. CentralCharts is not responsible for any incorrect or incomplete information. Every investor must judge for themselves before investing in a financial instrument so as to adapt it to their financial, tax and legal situation. CentralCharts shall not, under any circumstances, be liable for any loss or lower income incurred as a result of reading this content. Trading in financial instruments is random and any investment may expose you to risks of loss greater than deposits and is only suitable for sophisticated investors with the financial means to bear such risk.
Additional analysis
Quotes
ENGIE rating 16.005 EUR. On the day, this instrument gained +0.19% and was traded between 15.925 EUR and 16.030 EUR over the period. The price is currently at +0.50% from its lowest and -0.16% from its highest.15.925
16.030
16.005
A bullish gap was detected at the opening by the Central Gaps scanner. There are a lot of buyers and they have the upper hand in the very short term.
Opening Gap UP
Type : Bullish
Timeframe : Openning
So that you have an overall view of the price change, here is a table showing the variations over several periods:
Near a new HIGH record (5 years)
Type : Bullish
Timeframe : Weekly
Near a new HIGH record (1 year)
Type : Bullish
Timeframe : Weekly
Near a new HIGH record (1st january)
Type : Bullish
Timeframe : Weekly
New HIGH record (1 month)
Type : Bullish
Timeframe : Weekly
Technical
Technical analysis of ENGIE in 1H shows a strongly overall bullish trend. 92.86% of the signals given by moving averages are bullish. The overall trend is supported by the strong bullish signals from short-term moving averages. The Central Indicators market scanner currently does not detect any result that concerns moving averages.
Technical indicators are strongly bullish, suggesting that the price increase should continue.
Caution: the Central Indicators scanner currently detects an excess:
Williams %R indicator is overbought : over -20
Type : Neutral
Timeframe : 1 hour
Central Patterns, the market scanner focusing on chart patterns, resistances and supports found this result:
Near resistance of channel
Type : Bearish
Timeframe : 1 hour
The Central Candlesticks scanner which studies Japanese candlesticks did not detect anything.
ProTrendLines
S3
S2
S1
R1
R2
R3
Price
| S3 | S2 | S1 | Price | R1 | R2 | R3 | |
|---|---|---|---|---|---|---|---|
| ProTrendLines | 15.781 | 15.880 | 15.985 | 16.005 | 16.260 | 16.550 | 17.924 |
| Change (%) | -1.40% | -0.78% | -0.12% | - | +1.59% | +3.41% | +11.99% |
| Change | -0.224 | -0.125 | -0.020 | - | +0.255 | +0.545 | +1.919 |
| Level | Minor | Minor | Intermediate | - | Minor | Major | Intermediate |
Attention could also be paid to pivot points to set price objectives:
Daily
| Pivot points | S3 | S2 | S1 | PP | R1 | R2 | R3 |
|---|---|---|---|---|---|---|---|
| Standard | 15.637 | 15.708 | 15.842 | 15.913 | 16.047 | 16.118 | 16.252 |
| Camarilla | 15.919 | 15.937 | 15.956 | 15.975 | 15.994 | 16.013 | 16.031 |
| Woodie | 15.668 | 15.724 | 15.873 | 15.929 | 16.078 | 16.134 | 16.283 |
| Fibonacci | 15.708 | 15.787 | 15.835 | 15.913 | 15.992 | 16.040 | 16.118 |
Weekly
| Pivot points | S3 | S2 | S1 | PP | R1 | R2 | R3 |
|---|---|---|---|---|---|---|---|
| Standard | 15.333 | 15.467 | 15.698 | 15.832 | 16.063 | 16.197 | 16.428 |
| Camarilla | 15.830 | 15.863 | 15.897 | 15.930 | 15.964 | 15.997 | 16.030 |
| Woodie | 15.383 | 15.491 | 15.748 | 15.856 | 16.113 | 16.221 | 16.478 |
| Fibonacci | 15.467 | 15.606 | 15.692 | 15.832 | 15.971 | 16.057 | 16.197 |
Monthly
| Pivot points | S3 | S2 | S1 | PP | R1 | R2 | R3 |
|---|---|---|---|---|---|---|---|
| Standard | 13.755 | 14.179 | 14.845 | 15.269 | 15.935 | 16.359 | 17.025 |
| Camarilla | 15.210 | 15.310 | 15.410 | 15.510 | 15.610 | 15.710 | 15.810 |
| Woodie | 13.875 | 14.240 | 14.965 | 15.330 | 16.055 | 16.420 | 17.145 |
| Fibonacci | 14.179 | 14.596 | 14.853 | 15.269 | 15.686 | 15.943 | 16.359 |
Numerical data
The following are the details of the technical indicators and moving averages that were collected to generate this technical analysis:
Technical indicators
Moving averages
| RSI (14): | 63.29 | |
| MACD (12,26,9): | 0.0470 | |
| Directional Movement: | 11.410 | |
| AROON (14): | 85.714 | |
| DEMA (21): | 15.983 | |
| Parabolic SAR (0,02-0,02-0,2): | 15.843 | |
| Elder Ray (13): | 0.031 | |
| Super Trend (3,10): | 15.813 | |
| Zig ZAG (10): | 16.000 | |
| VORTEX (21): | 1.1340 | |
| Stochastique (14,3,5): | 88.64 | |
| TEMA (21): | 16.003 | |
| Williams %R (14): | -12.00 | |
| Chande Momentum Oscillator (20): | 0.190 | |
| Repulse (5,40,3): | 0.1710 | |
| ROCnROLL: | 1 | |
| TRIX (15,9): | 0.0370 | |
| Courbe Coppock: | 1.23 |
| MA7: | 15.844 | |
| MA20: | 15.684 | |
| MA50: | 15.210 | |
| MA100: | 15.451 | |
| MAexp7: | 15.976 | |
| MAexp20: | 15.924 | |
| MAexp50: | 15.857 | |
| MAexp100: | 15.782 | |
| Price / MA7: | +1.02% | |
| Price / MA20: | +2.05% | |
| Price / MA50: | +5.23% | |
| Price / MA100: | +3.59% | |
| Price / MAexp7: | +0.18% | |
| Price / MAexp20: | +0.51% | |
| Price / MAexp50: | +0.93% | |
| Price / MAexp100: | +1.41% |
Quotes :
-
15 min delayed data
-
Euronext Paris
News
The latest news and videos published on ENGIE at the time of the analysis were as follows:
- ENGIE sees continued strong growth in renewables in the U.S.
- ENGIE announces $1bn Tax Equity Financing for more than 1.3 GW of U.S. Renewables Assets
- Cupertino Union School District Announces Solar and EV Charging Stations Districtwide in Collaboration with ENGIE
- ENGIE Announces Commissioning of its 100MW+ Sun Valley Utility Scale Battery Storage Project in U.S.
- Dublin Unified School District Unveils $26 Million Sustainability and Energy Efficiency Project with ENGIE