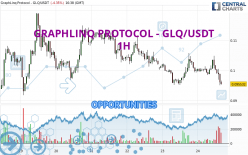
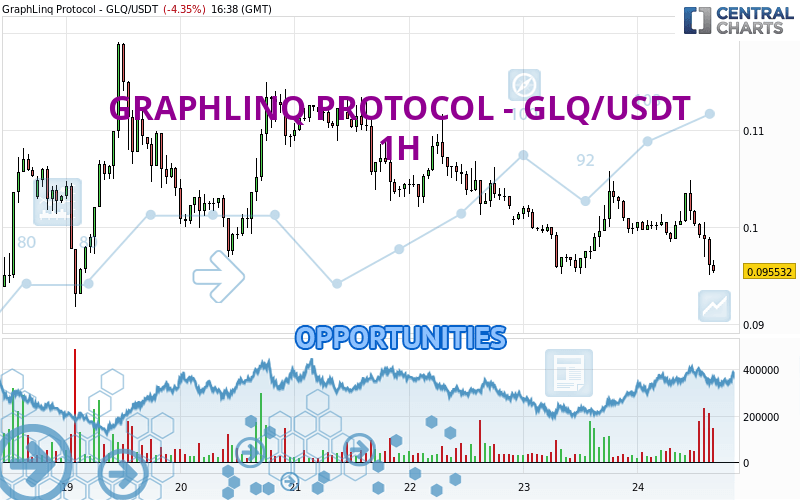
Londinia Opportunities Analyses - 04/24/2024 (GMT) GRAPHLINQ PROTOCOL - GLQ/USDT - 1H
| Type: | Cryptocurrencies |
| Ticker: | GLQUSDT |
| ISIN: |
I am delighted to see that my first price objective has been achieved. I hope you've taken advantage of it.
- Cryptocurrencies
- Timeframe : 1H
- - Analysis generated on
- Status : TARGET REACHED
Summary of the analysis
Trends
Short term:
Strongly bearish
Underlying:
Strongly bearish
Technical indicators
11%
72%
17%
My opinion
Bearish under 0.097114 USDT
My targets
0.091647 USDT (-4.05%)
0.086897 USDT (-9.02%)
My analysis
GRAPHLINQ PROTOCOL - GLQ/USDT is part of a very strong bearish trend. Traders may consider trading only short positions (for sale) as long as the price remains well below 0.097114 USDT. The next support located at 0.091647 USDT is the next bearish objective to target. A bearish break of this support would revive the bearish momentum. The bearish movement could then continue towards the next support located at 0.086897 USDT. Below this support, sellers could then target 0.081613 USDT. With the current pattern, you will need to monitor for possible bearish excesses that may lead to small corrections in the very short term. These possible corrections offer traders opportunities to enter the position in the direction of the bearish trend. Trying to profit from the purchase of these possible corrections may seem risky.
Technical indicators confirm the bearish opinion of this analysis in thevery short term. However, be careful of excessive bearish movements. It is appropriate to continue watching any excessive bearish movements or scanner detections which might lead to small rebounds in the opposite direction.
Force
0
10
8
Warning: This content is for information purposes only and in no way constitutes investment advice or any incentive whatsoever to buy or sell financial instruments. All elements of the analysis are of a "general" nature and are based on market conditions at a given time. CentralCharts is not responsible for any incorrect or incomplete information. Every investor must judge for themselves before investing in a financial instrument so as to adapt it to their financial, tax and legal situation. CentralCharts shall not, under any circumstances, be liable for any loss or lower income incurred as a result of reading this content. Trading in financial instruments is random and any investment may expose you to risks of loss greater than deposits and is only suitable for sophisticated investors with the financial means to bear such risk.
Additional analysis
Quotes
The GRAPHLINQ PROTOCOL - GLQ/USDT price is 0.095514 USDT. The price registered a decrease of -4.37% on the session and was between 0.095068 USDT and 0.104826 USDT. This implies that the price is at +0.47% from its lowest and at -8.88% from its highest.0.095068
0.104826
0.095514
A bullish opening was detected by the Central Gaps scanner. Buyers are trying to impose a bullish momentum in the very short term.
Bullish opening
Type : Bullish
Timeframe : Openning
A study of price movements over other periods shows the following variations:
Technical
Technical analysis of this 1H chart of GRAPHLINQ PROTOCOL - GLQ/USDT indicates that the overall trend is strongly bearish. 92.86% of the signals given by moving averages are bearish. The overall trend is supported by the strong bearish signals from short-term moving averages. The Central Indicators scanner does not detect any result on moving averages that would impact this trend.
In fact, 13 technical indicators on 18 studied are currently bearish. But beware of excesses. The Central Indicators scanner currently detects this:
CCI indicator is oversold : under -100
Type : Neutral
Timeframe : 1 hour
Previous candle closed under Bollinger bands
Type : Neutral
Timeframe : 1 hour
Williams %R indicator is oversold : under -80
Type : Neutral
Timeframe : 1 hour
Price is back under the pivot point
Type : Bearish
Timeframe : Weekly
Central Patterns, the scanner specializing in chart patterns, did not identify any signals.
For a small rebound in the very short term, the Central Candlesticks scanner currently notes the presence of this bullish pattern in Japanese candlesticks:
Bullish harami
Type : Bullish
Timeframe : 1 hour
ProTrendLines
S3
S2
S1
R1
R2
R3
Price
| S3 | S2 | S1 | Price | R1 | R2 | R3 | |
|---|---|---|---|---|---|---|---|
| ProTrendLines | 0.066835 | 0.081613 | 0.091647 | 0.095514 | 0.097114 | 0.102158 | 0.110012 |
| Change (%) | -30.03% | -14.55% | -4.05% | - | +1.68% | +6.96% | +15.18% |
| Change | -0.028679 | -0.013901 | -0.003867 | - | +0.001600 | +0.006644 | +0.014498 |
| Level | Minor | Minor | Major | - | Major | Minor | Intermediate |
To determine price objectives, it is also possible to use the pivot points. Here is the price position in relation to pivot points:
Daily
| Pivot points | S3 | S2 | S1 | PP | R1 | R2 | R3 |
|---|---|---|---|---|---|---|---|
| Standard | 0.084152 | 0.089668 | 0.094772 | 0.100288 | 0.105392 | 0.110908 | 0.116012 |
| Camarilla | 0.096957 | 0.097930 | 0.098904 | 0.099877 | 0.100851 | 0.101824 | 0.102798 |
| Woodie | 0.083947 | 0.089565 | 0.094567 | 0.100185 | 0.105187 | 0.110805 | 0.115807 |
| Fibonacci | 0.089668 | 0.093725 | 0.096231 | 0.100288 | 0.104345 | 0.106851 | 0.110908 |
Weekly
| Pivot points | S3 | S2 | S1 | PP | R1 | R2 | R3 |
|---|---|---|---|---|---|---|---|
| Standard | 0.047110 | 0.064362 | 0.086897 | 0.104149 | 0.126684 | 0.143936 | 0.166471 |
| Camarilla | 0.098492 | 0.102139 | 0.105786 | 0.109433 | 0.113080 | 0.116727 | 0.120374 |
| Woodie | 0.049753 | 0.065683 | 0.089540 | 0.105470 | 0.129327 | 0.145257 | 0.169114 |
| Fibonacci | 0.064362 | 0.079560 | 0.088950 | 0.104149 | 0.119347 | 0.128737 | 0.143936 |
Monthly
| Pivot points | S3 | S2 | S1 | PP | R1 | R2 | R3 |
|---|---|---|---|---|---|---|---|
| Standard | -0.059993 | 0.003409 | 0.071624 | 0.135026 | 0.203241 | 0.266643 | 0.334858 |
| Camarilla | 0.103645 | 0.115710 | 0.127775 | 0.139840 | 0.151905 | 0.163970 | 0.176035 |
| Woodie | -0.057586 | 0.004612 | 0.074032 | 0.136229 | 0.205649 | 0.267846 | 0.337266 |
| Fibonacci | 0.003409 | 0.053686 | 0.084748 | 0.135026 | 0.185303 | 0.216365 | 0.266643 |
Numerical data
The following is the status of technical indicators and moving averages registered at the time this technical analysis was created:
Technical indicators
Moving averages
| RSI (14): | 36.94 | |
| MACD (12,26,9): | -0.0007 | |
| Directional Movement: | -6.106377 | |
| AROON (14): | -28.571429 | |
| DEMA (21): | 0.098813 | |
| Parabolic SAR (0,02-0,02-0,2): | 0.103836 | |
| Elder Ray (13): | -0.003230 | |
| Super Trend (3,10): | 0.102289 | |
| Zig ZAG (10): | 0.096320 | |
| VORTEX (21): | 0.8029 | |
| Stochastique (14,3,5): | 15.50 | |
| TEMA (21): | 0.098596 | |
| Williams %R (14): | -89.02 | |
| Chande Momentum Oscillator (20): | -0.004066 | |
| Repulse (5,40,3): | -2.6846 | |
| ROCnROLL: | 2 | |
| TRIX (15,9): | -0.0216 | |
| Courbe Coppock: | 3.21 |
| MA7: | 0.102632 | |
| MA20: | 0.110112 | |
| MA50: | 0.129903 | |
| MA100: | 0.085126 | |
| MAexp7: | 0.098327 | |
| MAexp20: | 0.099520 | |
| MAexp50: | 0.100700 | |
| MAexp100: | 0.101836 | |
| Price / MA7: | -6.94% | |
| Price / MA20: | -13.26% | |
| Price / MA50: | -26.47% | |
| Price / MA100: | +12.20% | |
| Price / MAexp7: | -2.86% | |
| Price / MAexp20: | -4.03% | |
| Price / MAexp50: | -5.15% | |
| Price / MAexp100: | -6.21% |
Quotes :
-
Real time data
-
Cryptocompare