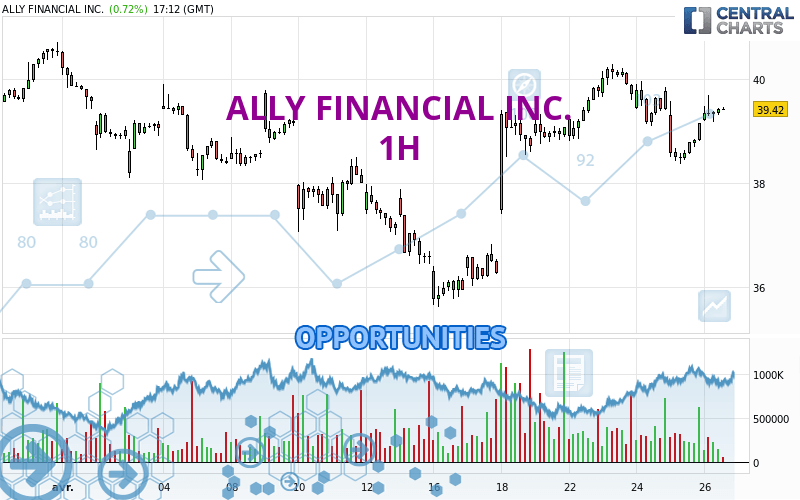
Londinia Opportunities Analyses - 04/26/2024 (GMT) ALLY FINANCIAL INC. - 1H
- U.S. Stocks
- Timeframe : 1H
- - Analysis generated on
- Status : INVALID
Summary of the analysis
Trends
Short term:
Bullish
Underlying:
Strongly bullish
Technical indicators
67%
11%
22%
My opinion
Bullish above 39.16 USD
My targets
39.80 USD (+0.84%)
40.71 USD (+3.14%)
My analysis
The basic bullish trend is very strong on ALLY FINANCIAL INC. but the short term shows some signs of running out of steam. However, a purchase could be considered as long as the price remains above 39.16 USD. Crossing the first resistance at 39.80 USD would be a sign of a potential new surge in the price. Buyers would then use the next resistance located at 40.71 USD as an objective. Crossing it would then enable buyers to target 41.71 USD. Caution, a return to below 39.16 USD would be a sign of a consolidation phase in the short-term basic trend. If this is the case, remember that trading against the trend may be riskier. It would seem more appropriate to wait for a signal indicating reversal of the trend.
Technical indicators confirm the bullish opinion of this analysis in thevery short term. However, be careful of excessive bullish movements. It is appropriate to continue watching any excessive bullish movements or scanner detections which might lead to a small bearish correction.
Force
0
10
7.1

Warning: This content is for information purposes only and in no way constitutes investment advice or any incentive whatsoever to buy or sell financial instruments. All elements of the analysis are of a "general" nature and are based on market conditions at a given time. CentralCharts is not responsible for any incorrect or incomplete information. Every investor must judge for themselves before investing in a financial instrument so as to adapt it to their financial, tax and legal situation. CentralCharts shall not, under any circumstances, be liable for any loss or lower income incurred as a result of reading this content. Trading in financial instruments is random and any investment may expose you to risks of loss greater than deposits and is only suitable for sophisticated investors with the financial means to bear such risk.
Additional analysis
Quotes
The ALLY FINANCIAL INC. price is 39.47 USD. On the day, this instrument gained +0.84% with the lowest point at 39.18 USD and the highest point at 39.69 USD. The deviation from the price is +0.74% for the low point and -0.55% for the high point.39.18
39.69
39.47
The Central Gaps scanner detects a bullish opening. A small advantage for buyers in the very short term.
Bullish opening
Type : Bullish
Timeframe : Openning
A study of price movements over other periods shows the following variations:
Near a new HIGH record (1 year)
Type : Bullish
Timeframe : Weekly
Near a new HIGH record (1st january)
Type : Bullish
Timeframe : Weekly
Near a new HIGH record (1 month)
Type : Bullish
Timeframe : Weekly
Technical
A technical analysis in 1H of this ALLY FINANCIAL INC. chart shows a strongly bullish trend. 89.29% of the signals given by moving averages are bullish. The slightly bullish signals given by the short-term moving averages indicate this trend is showing signs of running out of steam. The Central Indicators scanner does not detect any result on moving averages that would impact this trend.
In fact, 12 technical indicators on 18 studied are currently bullish. Central Indicators, the scanner specialised in technical indicators, has identified this signal:
MACD crosses UP its Moving Average
Type : Bullish
Timeframe : 1 hour
No signals are given by Central Patterns, a market scanner specialised in chart patterns, resistances and supports.
The Central Candlesticks scanner, specialised in Japanese candlesticks, did not identify any signals.
ProTrendLines
S3
S2
S1
R1
R2
R3
Price
| S3 | S2 | S1 | Price | R1 | R2 | R3 | |
|---|---|---|---|---|---|---|---|
| ProTrendLines | 37.07 | 38.08 | 39.16 | 39.47 | 39.80 | 40.71 | 41.71 |
| Change (%) | -6.08% | -3.52% | -0.79% | - | +0.84% | +3.14% | +5.68% |
| Change | -2.40 | -1.39 | -0.31 | - | +0.33 | +1.24 | +2.24 |
| Level | Minor | Intermediate | Intermediate | - | Minor | Intermediate | Major |
Pivot points can also be used to set your price objectives. Here is the price situation in relation to pivot points:
Daily
| Pivot points | S3 | S2 | S1 | PP | R1 | R2 | R3 |
|---|---|---|---|---|---|---|---|
| Standard | 37.25 | 37.81 | 38.47 | 39.03 | 39.69 | 40.25 | 40.91 |
| Camarilla | 38.81 | 38.92 | 39.03 | 39.14 | 39.25 | 39.36 | 39.48 |
| Woodie | 37.31 | 37.84 | 38.53 | 39.06 | 39.75 | 40.28 | 40.97 |
| Fibonacci | 37.81 | 38.27 | 38.56 | 39.03 | 39.49 | 39.78 | 40.25 |
Weekly
| Pivot points | S3 | S2 | S1 | PP | R1 | R2 | R3 |
|---|---|---|---|---|---|---|---|
| Standard | 32.76 | 34.19 | 36.62 | 38.05 | 40.48 | 41.91 | 44.34 |
| Camarilla | 37.99 | 38.34 | 38.70 | 39.05 | 39.40 | 39.76 | 40.11 |
| Woodie | 33.26 | 34.44 | 37.12 | 38.30 | 40.98 | 42.16 | 44.84 |
| Fibonacci | 34.19 | 35.67 | 36.58 | 38.05 | 39.53 | 40.44 | 41.91 |
Monthly
| Pivot points | S3 | S2 | S1 | PP | R1 | R2 | R3 |
|---|---|---|---|---|---|---|---|
| Standard | 30.58 | 32.97 | 36.78 | 39.17 | 42.98 | 45.37 | 49.18 |
| Camarilla | 38.89 | 39.45 | 40.02 | 40.59 | 41.16 | 41.73 | 42.30 |
| Woodie | 31.29 | 33.33 | 37.49 | 39.53 | 43.69 | 45.73 | 49.89 |
| Fibonacci | 32.97 | 35.34 | 36.80 | 39.17 | 41.54 | 43.00 | 45.37 |
Numerical data
The following is the status of technical indicators and moving averages registered at the time this technical analysis was created:
Technical indicators
Moving averages
| RSI (14): | 55.14 | |
| MACD (12,26,9): | 0.0200 | |
| Directional Movement: | 10.80 | |
| AROON (14): | -21.43 | |
| DEMA (21): | 39.25 | |
| Parabolic SAR (0,02-0,02-0,2): | 38.49 | |
| Elder Ray (13): | 0.18 | |
| Super Trend (3,10): | 39.68 | |
| Zig ZAG (10): | 39.42 | |
| VORTEX (21): | 0.8700 | |
| Stochastique (14,3,5): | 68.13 | |
| TEMA (21): | 39.07 | |
| Williams %R (14): | -28.38 | |
| Chande Momentum Oscillator (20): | 0.00 | |
| Repulse (5,40,3): | 0.6600 | |
| ROCnROLL: | 1 | |
| TRIX (15,9): | 0.0000 | |
| Courbe Coppock: | 2.23 |
| MA7: | 39.36 | |
| MA20: | 38.49 | |
| MA50: | 37.96 | |
| MA100: | 36.11 | |
| MAexp7: | 39.28 | |
| MAexp20: | 39.20 | |
| MAexp50: | 38.95 | |
| MAexp100: | 38.67 | |
| Price / MA7: | +0.28% | |
| Price / MA20: | +2.55% | |
| Price / MA50: | +3.98% | |
| Price / MA100: | +9.30% | |
| Price / MAexp7: | +0.48% | |
| Price / MAexp20: | +0.69% | |
| Price / MAexp50: | +1.34% | |
| Price / MAexp100: | +2.07% |
Quotes :
-
15 min delayed data
-
Actions NYSE
News
The last news published on ALLY FINANCIAL INC. at the time of the generation of this analysis was as follows:
- Ally Financial reports first quarter 2024 financial results
- Ascendion Receives Ally Financial Innovation Award at 2024 Supplier Symposium
- Ally Financial declares dividend on common stock and Series B and Series C preferred stock
- Ally Financial names Michael Rhodes as CEO
- Charlotte Sports Foundation and Ally Financial Unveil 2024 Ally Tipoff Lineup and Extend Partnership through 2026