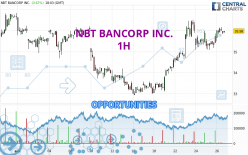
Londinia Opportunities Analyses - 04/26/2024 (GMT) NBT BANCORP INC. - 1H
- U.S. Stocks
- Timeframe : 1H
- - Analysis generated on
- Status : INVALID
Summary of the analysis
Trends
Short term:
Bullish
Underlying:
Strongly bullish
Technical indicators
67%
6%
28%
My opinion
Bullish above 35.70 USD
My targets
36.23 USD (+0.78%)
36.84 USD (+2.48%)
My analysis
The basic bullish trend is very strong on NBT BANCORP INC. but the short term shows some signs of running out of steam. However, a purchase could be considered as long as the price remains above 35.70 USD. Crossing the first resistance at 36.23 USD would be a sign of a potential new surge in the price. Buyers would then use the next resistance located at 36.84 USD as an objective. Crossing it would then enable buyers to target 38.51 USD. Caution, a return to below 35.70 USD would be a sign of a consolidation phase in the short-term basic trend. If this is the case, remember that trading against the trend may be riskier. It would seem more appropriate to wait for a signal indicating reversal of the trend.
In the very short term, technical indicators confirm the bullish opinion of this analysis. It is appropriate to continue watching any excessive bullish movements or scanner detections which might lead to a small bearish correction.
Force
0
10
7.3

Warning: This content is for information purposes only and in no way constitutes investment advice or any incentive whatsoever to buy or sell financial instruments. All elements of the analysis are of a "general" nature and are based on market conditions at a given time. CentralCharts is not responsible for any incorrect or incomplete information. Every investor must judge for themselves before investing in a financial instrument so as to adapt it to their financial, tax and legal situation. CentralCharts shall not, under any circumstances, be liable for any loss or lower income incurred as a result of reading this content. Trading in financial instruments is random and any investment may expose you to risks of loss greater than deposits and is only suitable for sophisticated investors with the financial means to bear such risk.
Additional analysis
Quotes
The NBT BANCORP INC. price is 35.95 USD. The price registered an increase of +0.59% on the session with the lowest point at 35.50 USD and the highest point at 36.17 USD. The deviation from the price is +1.27% for the low point and -0.61% for the high point.35.50
36.17
35.95
The Central Gaps scanner detects a bearish opening. A small advantage for sellers in the very short term.
Bearish opening
Type : Bearish
Timeframe : Openning
Here is a more detailed summary of the historical variations registered by NBT BANCORP INC.:
Near a new HIGH record (1 month)
Type : Bullish
Timeframe : Weekly
Technical
Technical analysis of this 1H chart of NBT BANCORP INC. indicates that the overall trend is strongly bullish. 89.29% of the signals given by moving averages are bullish. The slightly bullish signals given by the short-term moving averages show a weakening of the global trend. There is no crossing of moving average by the price or crossing of moving averages between themselves.
The technical indicators are bullish. There is still some doubt about the price increase.
Other results related to technical indicators were also found by the Central Indicators scanner:
Pivot points : price is over resistance 1
Type : Neutral
Timeframe : 1 hour
Pivot points : price is over resistance 2
Type : Neutral
Timeframe : Weekly
MACD crosses DOWN its Moving Average
Type : Bearish
Timeframe : 1 hour
No signals are given by Central Patterns, a market scanner specialised in chart patterns, resistances and supports.
The presence of these Japanese chandelier patterns detected by Central Candlesticks that could impact the current short-term trend were also noted:
Downside gap
Type : Bearish
Timeframe : 1 hour
Three white soldiers
Type : Bullish
Timeframe : 1 hour
ProTrendLines
S3
S2
S1
R1
R2
R3
Price
| S3 | S2 | S1 | Price | R1 | R2 | R3 | |
|---|---|---|---|---|---|---|---|
| ProTrendLines | 33.58 | 35.25 | 35.70 | 35.95 | 36.23 | 36.84 | 38.51 |
| Change (%) | -6.59% | -1.95% | -0.70% | - | +0.78% | +2.48% | +7.12% |
| Change | -2.37 | -0.70 | -0.25 | - | +0.28 | +0.89 | +2.56 |
| Level | Minor | Major | Minor | - | Intermediate | Minor | Major |
Pivot points can also be used to set your price objectives. Here is the price situation in relation to pivot points:
Daily
| Pivot points | S3 | S2 | S1 | PP | R1 | R2 | R3 |
|---|---|---|---|---|---|---|---|
| Standard | 34.50 | 34.79 | 35.27 | 35.56 | 36.04 | 36.33 | 36.81 |
| Camarilla | 35.53 | 35.60 | 35.67 | 35.74 | 35.81 | 35.88 | 35.95 |
| Woodie | 34.59 | 34.84 | 35.36 | 35.61 | 36.13 | 36.38 | 36.90 |
| Fibonacci | 34.79 | 35.09 | 35.27 | 35.56 | 35.86 | 36.04 | 36.33 |
Weekly
| Pivot points | S3 | S2 | S1 | PP | R1 | R2 | R3 |
|---|---|---|---|---|---|---|---|
| Standard | 31.73 | 32.33 | 33.47 | 34.07 | 35.21 | 35.81 | 36.95 |
| Camarilla | 34.13 | 34.29 | 34.45 | 34.61 | 34.77 | 34.93 | 35.09 |
| Woodie | 32.00 | 32.47 | 33.74 | 34.21 | 35.48 | 35.95 | 37.22 |
| Fibonacci | 32.33 | 33.00 | 33.41 | 34.07 | 34.74 | 35.15 | 35.81 |
Monthly
| Pivot points | S3 | S2 | S1 | PP | R1 | R2 | R3 |
|---|---|---|---|---|---|---|---|
| Standard | 29.98 | 31.39 | 34.03 | 35.44 | 38.08 | 39.49 | 42.13 |
| Camarilla | 35.57 | 35.94 | 36.31 | 36.68 | 37.05 | 37.42 | 37.79 |
| Woodie | 30.61 | 31.70 | 34.66 | 35.75 | 38.71 | 39.80 | 42.76 |
| Fibonacci | 31.39 | 32.93 | 33.89 | 35.44 | 36.98 | 37.94 | 39.49 |
Numerical data
The following is the status of the technical indicators and moving averages at the time of publication of this technical analysis:
Technical indicators
Moving averages
| RSI (14): | 58.84 | |
| MACD (12,26,9): | 0.2500 | |
| Directional Movement: | 8.68 | |
| AROON (14): | 57.15 | |
| DEMA (21): | 36.00 | |
| Parabolic SAR (0,02-0,02-0,2): | 35.21 | |
| Elder Ray (13): | 0.15 | |
| Super Trend (3,10): | 35.20 | |
| Zig ZAG (10): | 35.91 | |
| VORTEX (21): | 0.9900 | |
| Stochastique (14,3,5): | 85.62 | |
| TEMA (21): | 35.95 | |
| Williams %R (14): | -24.07 | |
| Chande Momentum Oscillator (20): | 0.01 | |
| Repulse (5,40,3): | 0.4100 | |
| ROCnROLL: | 1 | |
| TRIX (15,9): | 0.1000 | |
| Courbe Coppock: | 1.42 |
| MA7: | 35.18 | |
| MA20: | 34.89 | |
| MA50: | 34.73 | |
| MA100: | 36.57 | |
| MAexp7: | 35.89 | |
| MAexp20: | 35.65 | |
| MAexp50: | 35.17 | |
| MAexp100: | 34.91 | |
| Price / MA7: | +2.19% | |
| Price / MA20: | +3.04% | |
| Price / MA50: | +3.51% | |
| Price / MA100: | -1.70% | |
| Price / MAexp7: | +0.17% | |
| Price / MAexp20: | +0.84% | |
| Price / MAexp50: | +2.22% | |
| Price / MAexp100: | +2.98% |
Quotes :
-
15 min delayed data
-
Actions NASDAQ
News
Don't forget to follow the news on NBT BANCORP INC.. At the time of publication of this analysis, the latest news was as follows:
- COSMAX NBT Showcases Exclusive Materials and Formulations at SSW 2023, Strengthening its Presence in the U.S. Market
- Shareholder Alert: Ademi LLP investigates whether Salisbury Bancorp, Inc. has obtained a Fair Price in its Transaction with NBT
- 1000 times intestinal survival rate...COSMAX NBT commercializes 'Zeta Probiotics™' Technology
- Nexstim Plc: Health Canada Grants Nexstim NBT® Medical Device License for Canada
- Nexstim NBT® System with SmartFocus® TMS installed at Rockford Psychiatric Medical Services, US