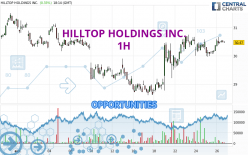
Londinia Opportunities Analyses - 04/26/2024 (GMT) HILLTOP HOLDINGS INC. - 1H
- U.S. Stocks
- Timeframe : 1H
- - Analysis generated on
- Status : INVALID
Summary of the analysis
Trends
Short term:
Bullish
Underlying:
Strongly bullish
Technical indicators
72%
11%
17%
My opinion
Bullish above 30.16 USD
My targets
30.98 USD (+1.54%)
31.26 USD (+2.46%)
My analysis
All elements being clearly bullish, it would be possible for traders to trade only long positions (at the time of purchase) on HILLTOP HOLDINGS INC. as long as the price remains well above 30.16 USD. The buyers' bullish objective is set at 30.98 USD. A bullish break in this resistance would boost the bullish momentum. The buyers could then target the resistance located at 31.26 USD. If there is any crossing, the next objective would be the resistance located at 31.52 USD. Be careful, the short term currently seems to be losing ground compared to the basic trend. Longer time units should be analysed to identify possible overbought items that could be a sign of a possible short-term correction.
In the very short term, the general bullish sentiment is confirmed by technical indicators. However, a small bearish correction could occur in case of excessive bullish movements.
Force
0
10
7.3

Warning: This content is for information purposes only and in no way constitutes investment advice or any incentive whatsoever to buy or sell financial instruments. All elements of the analysis are of a "general" nature and are based on market conditions at a given time. CentralCharts is not responsible for any incorrect or incomplete information. Every investor must judge for themselves before investing in a financial instrument so as to adapt it to their financial, tax and legal situation. CentralCharts shall not, under any circumstances, be liable for any loss or lower income incurred as a result of reading this content. Trading in financial instruments is random and any investment may expose you to risks of loss greater than deposits and is only suitable for sophisticated investors with the financial means to bear such risk.
Additional analysis
Quotes
The HILLTOP HOLDINGS INC. price is 30.51 USD. The price registered an increase of +0.46% on the session with the lowest point at 30.34 USD and the highest point at 30.67 USD. The deviation from the price is +0.56% for the low point and -0.52% for the high point.30.34
30.67
30.51
A bearish opening was detected by the Central Gaps scanner. Sellers are trying to impose a bearish trend in the very short term.
Bearish opening
Type : Bearish
Timeframe : Openning
A study of price movements over other periods shows the following variations:
Near a new HIGH record (1 month)
Type : Bullish
Timeframe : Weekly
Technical
Technical analysis of this 1H chart of HILLTOP HOLDINGS INC. indicates that the overall trend is strongly bullish. 89.29% of the signals given by moving averages are bullish. The slightly bullish signals given by the short-term moving averages show a weakening of the global trend. The Central Indicators market scanner currently does not detect any result that concerns moving averages.
Technical indicators are strongly bullish, suggesting that the price increase should continue.
Central Indicators, the detector scanner for these technical indicators recently detected a signal:
Pivot points : price is over resistance 1
Type : Neutral
Timeframe : 1 hour
Central Patterns, the market scanner focusing on chart patterns, resistances and supports found this result:
Near resistance of channel
Type : Bearish
Timeframe : 1 hour
No result was found by the Central Candlesticks scanner on Japanese candlesticks.
ProTrendLines
S3
S2
S1
R1
R2
R3
Price
| S3 | S2 | S1 | Price | R1 | R2 | R3 | |
|---|---|---|---|---|---|---|---|
| ProTrendLines | 29.14 | 29.55 | 30.16 | 30.51 | 30.58 | 30.98 | 31.26 |
| Change (%) | -4.49% | -3.15% | -1.15% | - | +0.23% | +1.54% | +2.46% |
| Change | -1.37 | -0.96 | -0.35 | - | +0.07 | +0.47 | +0.75 |
| Level | Intermediate | Minor | Major | - | Intermediate | Major | Intermediate |
To determine price objectives, it is also possible to use the pivot points. Here is the price position in relation to pivot points:
Daily
| Pivot points | S3 | S2 | S1 | PP | R1 | R2 | R3 |
|---|---|---|---|---|---|---|---|
| Standard | 29.70 | 29.84 | 30.10 | 30.24 | 30.50 | 30.64 | 30.90 |
| Camarilla | 30.26 | 30.30 | 30.33 | 30.37 | 30.41 | 30.44 | 30.48 |
| Woodie | 29.77 | 29.87 | 30.17 | 30.27 | 30.57 | 30.67 | 30.97 |
| Fibonacci | 29.84 | 29.99 | 30.08 | 30.24 | 30.39 | 30.48 | 30.64 |
Weekly
| Pivot points | S3 | S2 | S1 | PP | R1 | R2 | R3 |
|---|---|---|---|---|---|---|---|
| Standard | 27.03 | 27.82 | 28.90 | 29.69 | 30.77 | 31.56 | 32.64 |
| Camarilla | 29.48 | 29.65 | 29.82 | 29.99 | 30.16 | 30.33 | 30.50 |
| Woodie | 27.19 | 27.89 | 29.06 | 29.76 | 30.93 | 31.63 | 32.80 |
| Fibonacci | 27.82 | 28.53 | 28.97 | 29.69 | 30.40 | 30.84 | 31.56 |
Monthly
| Pivot points | S3 | S2 | S1 | PP | R1 | R2 | R3 |
|---|---|---|---|---|---|---|---|
| Standard | 27.20 | 28.37 | 29.85 | 31.02 | 32.50 | 33.67 | 35.15 |
| Camarilla | 30.59 | 30.83 | 31.08 | 31.32 | 31.56 | 31.81 | 32.05 |
| Woodie | 27.35 | 28.45 | 30.00 | 31.10 | 32.65 | 33.75 | 35.30 |
| Fibonacci | 28.37 | 29.39 | 30.01 | 31.02 | 32.04 | 32.66 | 33.67 |
Numerical data
The following are the details of the technical indicators and moving averages that were collected to generate this technical analysis:
Technical indicators
Moving averages
| RSI (14): | 57.61 | |
| MACD (12,26,9): | 0.1100 | |
| Directional Movement: | 15.03 | |
| AROON (14): | 50.00 | |
| DEMA (21): | 30.49 | |
| Parabolic SAR (0,02-0,02-0,2): | 30.06 | |
| Elder Ray (13): | 0.13 | |
| Super Trend (3,10): | 29.92 | |
| Zig ZAG (10): | 30.50 | |
| VORTEX (21): | 0.9700 | |
| Stochastique (14,3,5): | 76.67 | |
| TEMA (21): | 30.44 | |
| Williams %R (14): | -24.29 | |
| Chande Momentum Oscillator (20): | 0.00 | |
| Repulse (5,40,3): | 0.2100 | |
| ROCnROLL: | 1 | |
| TRIX (15,9): | 0.0500 | |
| Courbe Coppock: | 0.41 |
| MA7: | 30.19 | |
| MA20: | 30.01 | |
| MA50: | 30.49 | |
| MA100: | 31.68 | |
| MAexp7: | 30.44 | |
| MAexp20: | 30.33 | |
| MAexp50: | 30.10 | |
| MAexp100: | 30.01 | |
| Price / MA7: | +1.06% | |
| Price / MA20: | +1.67% | |
| Price / MA50: | +0.07% | |
| Price / MA100: | -3.69% | |
| Price / MAexp7: | +0.23% | |
| Price / MAexp20: | +0.59% | |
| Price / MAexp50: | +1.36% | |
| Price / MAexp100: | +1.67% |
Quotes :
-
15 min delayed data
-
Actions NYSE
News
The last news published on HILLTOP HOLDINGS INC. at the time of the generation of this analysis was as follows:
- i-80 Gold Announces High-Grade Results from Hilltop Drilling at Ruby Hill
- HilltopSecurities Launches 3rd Annual Hilltop Hunt
- Scott McCaffrey Takes Top Job as Head of Momentum Independent Network
- Hilltop Holdings Inc. Announces Financial Results for Second Quarter 2023
- Hilltop Holdings Inc. Announces Second Quarter 2023 Earnings Conference Call and Webcast