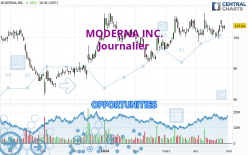
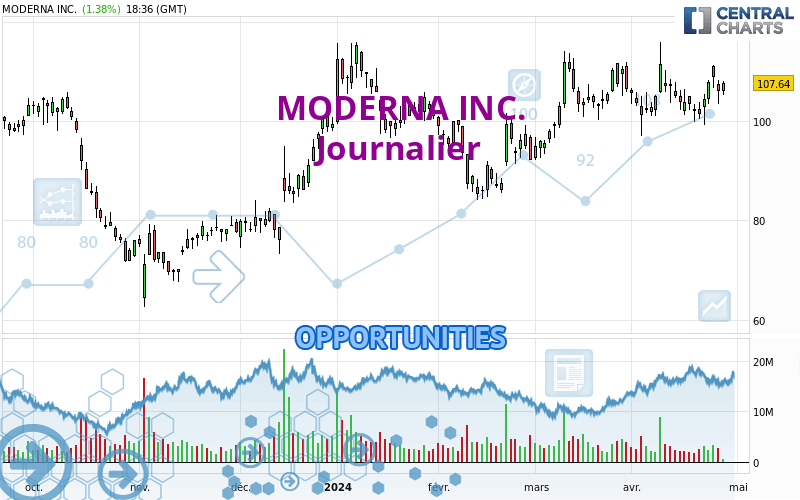
Londinia Opportunities Analyses - 04/26/2024 (GMT) MODERNA INC. - Daily
I am delighted to see that my first price objective has been achieved. I hope you've taken advantage of it.
- U.S. Stocks
- Timeframe : Daily
- - Analysis generated on
- Status : TARGET REACHED
Summary of the analysis
Trends
Short term:
Strongly bullish
Underlying:
Strongly bullish
Technical indicators
61%
17%
22%
My opinion
Bullish above 104.59 USD
My targets
111.80 USD (+3.88%)
116.63 USD (+8.37%)
My analysis
MODERNA INC. is part of a very strong bullish trend. Traders may consider trading only long positions (at the time of purchase) as long as the price remains well above 104.59 USD. The next resistance located at 111.80 USD is the next bullish objective to be reached. A bullish break in this resistance would boost the bullish momentum. The bullish movement could then continue towards the next resistance located at 116.63 USD. After this resistance, buyers could then target 121.35 USD. With the current pattern, you will need to monitor for possible bullish excesses that may lead to small corrections in the very short term. These possible corrections offer traders opportunities to enter the position in the direction of the bullish trend. Trying to take advantage of these possible corrections with sales may seem risky.
In the very short term, the general bullish sentiment is confirmed by technical indicators. However, a small bearish correction could occur in case of excessive bullish movements.
Force
0
10
7.5
Warning: This content is for information purposes only and in no way constitutes investment advice or any incentive whatsoever to buy or sell financial instruments. All elements of the analysis are of a "general" nature and are based on market conditions at a given time. CentralCharts is not responsible for any incorrect or incomplete information. Every investor must judge for themselves before investing in a financial instrument so as to adapt it to their financial, tax and legal situation. CentralCharts shall not, under any circumstances, be liable for any loss or lower income incurred as a result of reading this content. Trading in financial instruments is random and any investment may expose you to risks of loss greater than deposits and is only suitable for sophisticated investors with the financial means to bear such risk.
Additional analysis
Quotes
MODERNA INC. rating 107.62 USD. On the day, this instrument gained +1.36% and was traded between 105.25 USD and 108.15 USD over the period. The price is currently at +2.25% from its lowest and -0.49% from its highest.105.25
108.15
107.62
So that you have an overall view of the price change, here is a table showing the variations over several periods:
Technical
Technical analysis of this Journalier chart of MODERNA INC. indicates that the overall trend is strongly bullish. 92.86% of the signals given by moving averages are bullish. The overall trend is supported by the strong bullish signals from short-term moving averages. There is no crossing of moving average by the price or crossing of moving averages between themselves.
In fact, 11 technical indicators on 18 studied are currently bullish. Central Indicators, the scanner specialised in technical indicators, has identified these signals:
Pivot points : price is over resistance 1
Type : Neutral
Timeframe : Weekly
Momentum indicator is back over 0
Type : Bullish
Timeframe : Daily
Williams %R indicator is back over -50
Type : Bullish
Timeframe : Daily
The Central Patterns scanner, which studies chart patterns, resistances and supports, has identified this signal:
Near resistance of triangle
Type : Bearish
Timeframe : Daily
The Central Candlesticks scanner which studies Japanese candlesticks did not detect anything.
ProTrendLines
S3
S2
S1
R1
R2
R3
Price
| S3 | S2 | S1 | Price | R1 | R2 | R3 | |
|---|---|---|---|---|---|---|---|
| ProTrendLines | 77.77 | 85.37 | 104.59 | 107.62 | 111.80 | 116.63 | 121.35 |
| Change (%) | -27.74% | -20.67% | -2.82% | - | +3.88% | +8.37% | +12.76% |
| Change | -29.85 | -22.25 | -3.03 | - | +4.18 | +9.01 | +13.73 |
| Level | Minor | Intermediate | Major | - | Major | Major | Minor |
Pivot points can also be used to set your price objectives. Here is the price situation in relation to pivot points:
Daily
| Pivot points | S3 | S2 | S1 | PP | R1 | R2 | R3 |
|---|---|---|---|---|---|---|---|
| Standard | 99.01 | 101.27 | 103.72 | 105.98 | 108.43 | 110.69 | 113.14 |
| Camarilla | 104.89 | 105.32 | 105.75 | 106.18 | 106.61 | 107.04 | 107.48 |
| Woodie | 99.12 | 101.32 | 103.83 | 106.03 | 108.54 | 110.74 | 113.25 |
| Fibonacci | 101.27 | 103.07 | 104.18 | 105.98 | 107.78 | 108.89 | 110.69 |
Weekly
| Pivot points | S3 | S2 | S1 | PP | R1 | R2 | R3 |
|---|---|---|---|---|---|---|---|
| Standard | 92.21 | 96.06 | 98.73 | 102.58 | 105.25 | 109.10 | 111.77 |
| Camarilla | 99.62 | 100.22 | 100.81 | 101.41 | 102.01 | 102.61 | 103.20 |
| Woodie | 91.63 | 95.77 | 98.15 | 102.29 | 104.67 | 108.81 | 111.19 |
| Fibonacci | 96.06 | 98.55 | 100.09 | 102.58 | 105.07 | 106.61 | 109.10 |
Monthly
| Pivot points | S3 | S2 | S1 | PP | R1 | R2 | R3 |
|---|---|---|---|---|---|---|---|
| Standard | 72.22 | 82.17 | 94.36 | 104.31 | 116.50 | 126.45 | 138.64 |
| Camarilla | 100.47 | 102.50 | 104.53 | 106.56 | 108.59 | 110.62 | 112.65 |
| Woodie | 73.35 | 82.73 | 95.49 | 104.87 | 117.63 | 127.01 | 139.77 |
| Fibonacci | 82.17 | 90.62 | 95.85 | 104.31 | 112.76 | 117.99 | 126.45 |
Numerical data
The following are the details of the technical indicators and moving averages that were collected to generate this technical analysis:
Technical indicators
Moving averages
| RSI (14): | 55.72 | |
| MACD (12,26,9): | 0.9300 | |
| Directional Movement: | 5.11 | |
| AROON (14): | -64.29 | |
| DEMA (21): | 106.62 | |
| Parabolic SAR (0,02-0,02-0,2): | 114.60 | |
| Elder Ray (13): | 0.93 | |
| Super Trend (3,10): | 96.51 | |
| Zig ZAG (10): | 107.85 | |
| VORTEX (21): | 0.9700 | |
| Stochastique (14,3,5): | 50.19 | |
| TEMA (21): | 106.24 | |
| Williams %R (14): | -49.07 | |
| Chande Momentum Oscillator (20): | 0.61 | |
| Repulse (5,40,3): | 3.1700 | |
| ROCnROLL: | 1 | |
| TRIX (15,9): | 0.1100 | |
| Courbe Coppock: | 1.58 |
| MA7: | 105.51 | |
| MA20: | 105.07 | |
| MA50: | 102.23 | |
| MA100: | 99.03 | |
| MAexp7: | 106.33 | |
| MAexp20: | 105.33 | |
| MAexp50: | 102.98 | |
| MAexp100: | 100.79 | |
| Price / MA7: | +2.00% | |
| Price / MA20: | +2.43% | |
| Price / MA50: | +5.27% | |
| Price / MA100: | +8.67% | |
| Price / MAexp7: | +1.21% | |
| Price / MAexp20: | +2.17% | |
| Price / MAexp50: | +4.51% | |
| Price / MAexp100: | +6.78% |
Quotes :
-
15 min delayed data
-
Actions NASDAQ
News
The latest news and videos published on MODERNA INC. at the time of the analysis were as follows:
- Moderna To Present Respiratory & Cytomegalovirus Research at the ESCMID Global Congress
- Moderna and OpenAI Collaborate To Advance mRNA Medicine
- Moderna Announces Contract with Brazil to Supply 12.5 million COVID-19 Vaccines as Part of National Vaccination Campaign
- Moderna to Report First Quarter 2024 Financial Results on Thursday, May 2, 2024
- Phase 1/2 Interim Data on Moderna’s mRNA-3927, an Investigational mRNA Therapy for Propionic Acidemia, Published in Nature