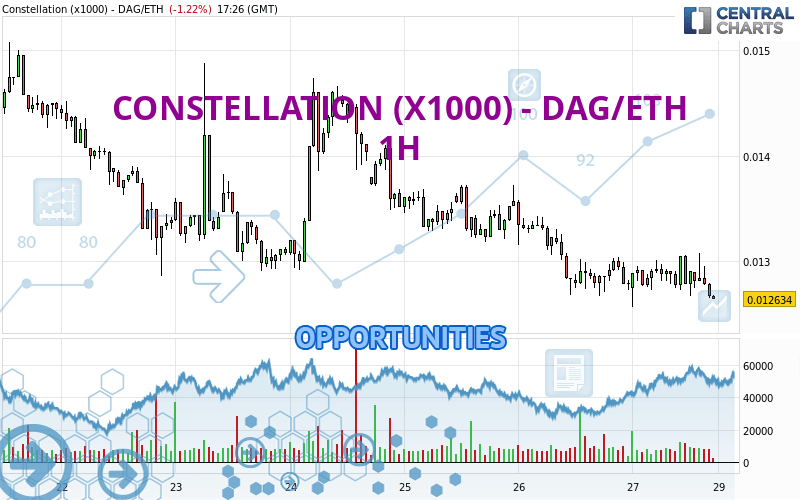
Londinia Opportunities Analyses - 04/27/2024 (GMT) CONSTELLATION (X1000) - DAG/ETH - 1H
| Type: | Cryptocurrencies |
| Ticker: | DAGETH |
| ISIN: |
I am delighted to see that my first price objective has been achieved. I hope you've taken advantage of it.
- Cryptocurrencies
- Timeframe : 1H
- - Analysis generated on
- Status : TARGET REACHED
Summary of the analysis
Trends
Short term:
Strongly bearish
Underlying:
Strongly bearish
Technical indicators
17%
72%
11%
My opinion
Bearish under 0.013363 ETH
My targets
0.011883 ETH (-6.11%)
0.010563 ETH (-16.54%)
My analysis
All elements being clearly bearish, it would be possible for traders to trade only short positions (for sale) on CONSTELLATION (X1000) - DAG/ETH as long as the price remains well below 0.013363 ETH. The sellers' bearish objective is set at 0.011883 ETH. A bearish break of this support would revive the bearish momentum. The sellers could then target the support located at 0.010563 ETH. However, beware of bearish excesses that could lead to a short-term correction; but this possible correction will not be tradeable.
Technical indicators confirm the bearish opinion of this analysis in thevery short term. However, be careful of excessive bearish movements. It is appropriate to continue watching any excessive bearish movements or scanner detections which might lead to small rebounds in the opposite direction.
Force
0
10
7.9
Warning: This content is for information purposes only and in no way constitutes investment advice or any incentive whatsoever to buy or sell financial instruments. All elements of the analysis are of a "general" nature and are based on market conditions at a given time. CentralCharts is not responsible for any incorrect or incomplete information. Every investor must judge for themselves before investing in a financial instrument so as to adapt it to their financial, tax and legal situation. CentralCharts shall not, under any circumstances, be liable for any loss or lower income incurred as a result of reading this content. Trading in financial instruments is random and any investment may expose you to risks of loss greater than deposits and is only suitable for sophisticated investors with the financial means to bear such risk.
Additional analysis
Quotes
CONSTELLATION (X1000) - DAG/ETH rating 0.012656 ETH. On the day, this instrument lost -1.05% with the lowest point at 0.012560 ETH and the highest point at 0.013070 ETH. The deviation from the price is +0.76% for the low point and -3.17% for the high point.0.012560
0.013070
0.012656
The Central Gaps scanner detects a bearish opening marking the presence of sellers ahead of buyers at the opening but not sufficiently marked to allow the price to register a quotation gap.
Bearish opening
Type : Bearish
Timeframe : Openning
A study of price movements over other periods shows the following variations:
New LOW record (1 year)
Type : Bearish
Timeframe : Weekly
New LOW record (1st january)
Type : Bearish
Timeframe : Weekly
New LOW record (1 month)
Type : Bearish
Timeframe : Weekly
Technical
Technical analysis of this 1H chart of CONSTELLATION (X1000) - DAG/ETH indicates that the overall trend is strongly bearish. 92.86% of the signals given by moving averages are bearish. The overall trend is supported by the strong bearish signals from short-term moving averages. The Central Indicators market scanner currently does not detect any result that concerns moving averages.
In fact, 13 technical indicators on 18 studied are currently positioned bearish. Caution: the Central Indicators scanner currently detects an excess:
CCI indicator is oversold : under -100
Type : Neutral
Timeframe : 1 hour
Williams %R indicator is oversold : under -80
Type : Neutral
Timeframe : 1 hour
Pivot points : price is under support 1
Type : Neutral
Timeframe : Weekly
Central Patterns, the market scanner focusing on chart patterns, resistances and supports found this result:
Near support of channel
Type : Bullish
Timeframe : 1 hour
From the Japanese candlestick perspective, the Central Candlesticks scanner notes the presence of these results that could impact the short-term trend:
Bullish harami
Type : Bullish
Timeframe : 1 hour
Bullish harami cross
Type : Bullish
Timeframe : 1 hour
Doji
Type : Neutral
Timeframe : 1 hour
ProTrendLines
R1
R2
R3
Price
| Price | R1 | R2 | R3 | |
|---|---|---|---|---|
| ProTrendLines | 0.012656 | 0.012667 | 0.013720 | 0.014343 |
| Change (%) | - | +0.09% | +8.41% | +13.33% |
| Change | - | +0.000011 | +0.001064 | +0.001687 |
| Level | - | Intermediate | Minor | Major |
Pivot points can also be used to set your price objectives. Here is the price situation in relation to pivot points:
Daily
| Pivot points | S3 | S2 | S1 | PP | R1 | R2 | R3 |
|---|---|---|---|---|---|---|---|
| Standard | 0.011538 | 0.012103 | 0.012446 | 0.013011 | 0.013354 | 0.013919 | 0.014262 |
| Camarilla | 0.012540 | 0.012624 | 0.012707 | 0.012790 | 0.012873 | 0.012957 | 0.013040 |
| Woodie | 0.011428 | 0.012048 | 0.012336 | 0.012956 | 0.013244 | 0.013864 | 0.014152 |
| Fibonacci | 0.012103 | 0.012450 | 0.012664 | 0.013011 | 0.013358 | 0.013572 | 0.013919 |
Weekly
| Pivot points | S3 | S2 | S1 | PP | R1 | R2 | R3 |
|---|---|---|---|---|---|---|---|
| Standard | 0.010563 | 0.011883 | 0.013363 | 0.014683 | 0.016163 | 0.017483 | 0.018963 |
| Camarilla | 0.014074 | 0.014331 | 0.014587 | 0.014844 | 0.015101 | 0.015357 | 0.015614 |
| Woodie | 0.010644 | 0.011923 | 0.013444 | 0.014723 | 0.016244 | 0.017523 | 0.019044 |
| Fibonacci | 0.011883 | 0.012952 | 0.013613 | 0.014683 | 0.015752 | 0.016413 | 0.017483 |
Monthly
| Pivot points | S3 | S2 | S1 | PP | R1 | R2 | R3 |
|---|---|---|---|---|---|---|---|
| Standard | 0.004481 | 0.010458 | 0.013820 | 0.019797 | 0.023159 | 0.029136 | 0.032498 |
| Camarilla | 0.014614 | 0.015470 | 0.016326 | 0.017182 | 0.018038 | 0.018894 | 0.019750 |
| Woodie | 0.003174 | 0.009804 | 0.012513 | 0.019143 | 0.021852 | 0.028482 | 0.031191 |
| Fibonacci | 0.010458 | 0.014026 | 0.016230 | 0.019797 | 0.023365 | 0.025569 | 0.029136 |
Numerical data
The following is the status of the technical indicators and moving averages at the time of publication of this technical analysis:
Technical indicators
Moving averages
| RSI (14): | 40.26 | |
| MACD (12,26,9): | -0.0001 | |
| Directional Movement: | -6.215322 | |
| AROON (14): | -14.285714 | |
| DEMA (21): | 0.012737 | |
| Parabolic SAR (0,02-0,02-0,2): | 0.013062 | |
| Elder Ray (13): | -0.000137 | |
| Super Trend (3,10): | 0.013174 | |
| Zig ZAG (10): | 0.012666 | |
| VORTEX (21): | 0.9314 | |
| Stochastique (14,3,5): | 12.36 | |
| TEMA (21): | 0.012756 | |
| Williams %R (14): | -93.63 | |
| Chande Momentum Oscillator (20): | -0.000244 | |
| Repulse (5,40,3): | -1.4858 | |
| ROCnROLL: | 2 | |
| TRIX (15,9): | -0.0712 | |
| Courbe Coppock: | 1.26 |
| MA7: | 0.013348 | |
| MA20: | 0.014496 | |
| MA50: | 0.017397 | |
| MA100: | 0.018854 | |
| MAexp7: | 0.012762 | |
| MAexp20: | 0.012857 | |
| MAexp50: | 0.013028 | |
| MAexp100: | 0.013287 | |
| Price / MA7: | -5.18% | |
| Price / MA20: | -12.69% | |
| Price / MA50: | -27.25% | |
| Price / MA100: | -32.87% | |
| Price / MAexp7: | -0.83% | |
| Price / MAexp20: | -1.56% | |
| Price / MAexp50: | -2.86% | |
| Price / MAexp100: | -4.75% |
Quotes :
-
Real time data
-
Cryptocompare