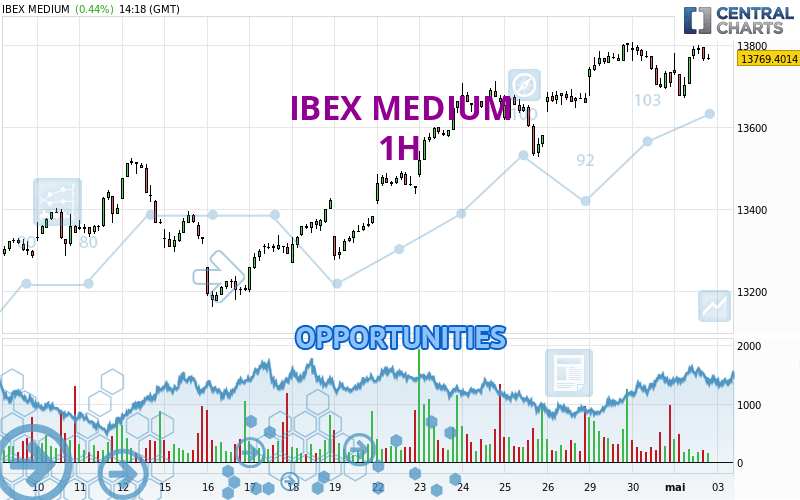
Londinia Opportunities Analyses - 05/02/2024 (GMT) IBEX MEDIUM - 1H
-
EUR
(-)
-
15 min delayed data - Spain Indices
| Type: | Indices |
| Ticker: | INDC |
| ISIN: | ES0SI0000013 |
I am delighted to see that my first price objective has been achieved. I hope you've taken advantage of it.
- FX/Indices
- Timeframe : 1H
- - Analysis generated on
- Status : TARGET REACHED
Summary of the analysis
Trends
Short term:
Strongly bullish
Underlying:
Strongly bullish
Technical indicators
67%
6%
28%
My opinion
Bullish above 13,711.8670 EUR
My targets
13,846.2000 EUR (+0.55%)
14,032.7900 EUR (+1.91%)
My analysis
All elements being clearly bullish, it would be possible for traders to trade only long positions (at the time of purchase) on IBEX MEDIUM as long as the price remains well above 13,711.8670 EUR. The buyers' bullish objective is set at 13,846.2000 EUR. A bullish break in this resistance would boost the bullish momentum. The buyers could then target the resistance located at 14,032.7900 EUR. If there is any crossing, the next objective would be the resistance located at 15,838.2400 EUR. However, beware of bullish excesses that could lead to a possible short-term correction; but this possible correction would not be tradeable.
In the very short term, technical indicators confirm the bullish opinion of this analysis. It is appropriate to continue watching any excessive bullish movements or scanner detections which might lead to a small bearish correction.
Force
0
10
8

Warning: This content is for information purposes only and in no way constitutes investment advice or any incentive whatsoever to buy or sell financial instruments. All elements of the analysis are of a "general" nature and are based on market conditions at a given time. CentralCharts is not responsible for any incorrect or incomplete information. Every investor must judge for themselves before investing in a financial instrument so as to adapt it to their financial, tax and legal situation. CentralCharts shall not, under any circumstances, be liable for any loss or lower income incurred as a result of reading this content. Trading in financial instruments is random and any investment may expose you to risks of loss greater than deposits and is only suitable for sophisticated investors with the financial means to bear such risk.
Additional analysis
Quotes
The IBEX MEDIUM rating is 13,770.2002 EUR. The price registered an increase of +0.45% on the session with the lowest point at 13,672.5996 EUR and the highest point at 13,801.9004 EUR. The deviation from the price is +0.71% for the low point and -0.23% for the high point.13,672.5996
13,801.9004
13,770.2002
The Central Gaps scanner detects a bullish opening marking the presence of buyers ahead of sellers at the opening but not sufficiently marked to allow the price to register a quotation gap.
Bullish opening
Type : Bullish
Timeframe : Openning
So that you have an overall view of the price change, here is a table showing the variations over several periods:
Near a new HIGH record (5 years)
Type : Bullish
Timeframe : Weekly
Near a new HIGH record (1 year)
Type : Bullish
Timeframe : Weekly
Near a new HIGH record (1st january)
Type : Bullish
Timeframe : Weekly
Near a new LOW record (1 month)
Type : Bearish
Timeframe : Weekly
Technical
Technical analysis of IBEX MEDIUM in 1H shows a strongly overall bullish trend. 92.86% of the signals given by moving averages are bullish. This strongly bullish trend is supported by the strong bullish signals given by short-term moving averages. An assessment of moving averages reveals a bearish signal that could impact this trend:
Bearish trend reversal : Moving Average 20
Type : Bearish
Timeframe : 1 hour
In fact, 12 technical indicators on 18 studied are currently positioned bullish. The Central Indicators scanner found this result concerning these indicators:
Momentum indicator is back over 0
Type : Bullish
Timeframe : 1 hour
Central Patterns, the scanner specializing in chart patterns, did not identify any signals.
Central Candlesticks, the scanner specialised in Japanese candlesticks, detects these signals that could have an impact on the current short-term trend:
Bullish harami
Type : Bullish
Timeframe : 1 hour
Bullish harami cross
Type : Bullish
Timeframe : 1 hour
Doji
Type : Neutral
Timeframe : 1 hour
ProTrendLines
S3
S2
S1
R1
R2
R3
Price
| S3 | S2 | S1 | Price | R1 | R2 | R3 | |
|---|---|---|---|---|---|---|---|
| ProTrendLines | 13,526.8990 | 13,645.7295 | 13,711.8670 | 13,770.2002 | 13,846.2000 | 14,032.7900 | 15,838.2400 |
| Change (%) | -1.77% | -0.90% | -0.42% | - | +0.55% | +1.91% | +15.02% |
| Change | -243.3012 | -124.4707 | -58.3332 | - | +75.9998 | +262.5898 | +2,068.0398 |
| Level | Major | Intermediate | Minor | - | Major | Major | Minor |
To determine price objectives, it is also possible to use the pivot points. Here is the price position in relation to pivot points:
Daily
| Pivot points | S3 | S2 | S1 | PP | R1 | R2 | R3 |
|---|---|---|---|---|---|---|---|
| Standard | 13,544.2337 | 13,619.0671 | 13,663.8333 | 13,738.6667 | 13,783.4329 | 13,858.2663 | 13,903.0325 |
| Camarilla | 13,675.7097 | 13,686.6730 | 13,697.6363 | 13,708.5996 | 13,719.5629 | 13,730.5262 | 13,741.4895 |
| Woodie | 13,529.2002 | 13,611.5503 | 13,648.7998 | 13,731.1499 | 13,768.3994 | 13,850.7495 | 13,887.9990 |
| Fibonacci | 13,619.0671 | 13,664.7541 | 13,692.9796 | 13,738.6667 | 13,784.3537 | 13,812.5792 | 13,858.2663 |
Weekly
| Pivot points | S3 | S2 | S1 | PP | R1 | R2 | R3 |
|---|---|---|---|---|---|---|---|
| Standard | 13,169.9329 | 13,289.7663 | 13,474.8333 | 13,594.6667 | 13,779.7337 | 13,899.5671 | 14,084.6341 |
| Camarilla | 13,576.0528 | 13,604.0020 | 13,631.9512 | 13,659.9004 | 13,687.8496 | 13,715.7988 | 13,743.7480 |
| Woodie | 13,202.5498 | 13,306.0747 | 13,507.4502 | 13,610.9751 | 13,812.3506 | 13,915.8755 | 14,117.2510 |
| Fibonacci | 13,289.7663 | 13,406.2382 | 13,478.1947 | 13,594.6667 | 13,711.1386 | 13,783.0951 | 13,899.5671 |
Monthly
| Pivot points | S3 | S2 | S1 | PP | R1 | R2 | R3 |
|---|---|---|---|---|---|---|---|
| Standard | 12,652.8991 | 12,905.9993 | 13,307.2995 | 13,560.3997 | 13,961.6999 | 14,214.8001 | 14,616.1003 |
| Camarilla | 13,528.6395 | 13,588.6262 | 13,648.6129 | 13,708.5996 | 13,768.5863 | 13,828.5730 | 13,888.5597 |
| Woodie | 12,726.9990 | 12,943.0493 | 13,381.3994 | 13,597.4497 | 14,035.7998 | 14,251.8501 | 14,690.2002 |
| Fibonacci | 12,905.9993 | 13,155.9803 | 13,310.4188 | 13,560.3997 | 13,810.3807 | 13,964.8192 | 14,214.8001 |
Numerical data
The following is the status of the technical indicators and moving averages at the time of publication of this technical analysis:
Technical indicators
Moving averages
| RSI (14): | 56.25 | |
| MACD (12,26,9): | 17.4668 | |
| Directional Movement: | 5.4734 | |
| AROON (14): | 21.4286 | |
| DEMA (21): | 13,770.4403 | |
| Parabolic SAR (0,02-0,02-0,2): | 13,685.0131 | |
| Elder Ray (13): | 18.5441 | |
| Super Trend (3,10): | 13,804.6525 | |
| Zig ZAG (10): | 13,772.2998 | |
| VORTEX (21): | 0.9808 | |
| Stochastique (14,3,5): | 81.48 | |
| TEMA (21): | 13,759.8691 | |
| Williams %R (14): | -23.82 | |
| Chande Momentum Oscillator (20): | 27.8994 | |
| Repulse (5,40,3): | -0.0340 | |
| ROCnROLL: | 1 | |
| TRIX (15,9): | 0.0166 | |
| Courbe Coppock: | 0.23 |
| MA7: | 13,692.9429 | |
| MA20: | 13,469.2400 | |
| MA50: | 13,272.6740 | |
| MA100: | 13,312.4580 | |
| MAexp7: | 13,761.2890 | |
| MAexp20: | 13,745.5592 | |
| MAexp50: | 13,692.2998 | |
| MAexp100: | 13,601.2943 | |
| Price / MA7: | +0.56% | |
| Price / MA20: | +2.23% | |
| Price / MA50: | +3.75% | |
| Price / MA100: | +3.44% | |
| Price / MAexp7: | +0.06% | |
| Price / MAexp20: | +0.18% | |
| Price / MAexp50: | +0.57% | |
| Price / MAexp100: | +1.24% |
Quotes :
-
15 min delayed data
-
Indices Espagne