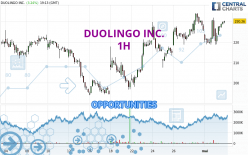
Londinia Opportunities Analyses - 05/02/2024 (GMT) DUOLINGO INC. - 1H
I am delighted to see that my first price objective has been achieved. I hope you've taken advantage of it.
- U.S. Stocks
- Timeframe : 1H
- - Analysis generated on
- Status : TARGET REACHED
Summary of the analysis
Trends
Short term:
Strongly bullish
Underlying:
Strongly bullish
Technical indicators
83%
6%
11%
My opinion
Bullish above 225.98 USD
My targets
234.21 USD (+2.07%)
239.74 USD (+4.48%)
My analysis
All elements being clearly bullish, it would be possible for traders to trade only long positions (at the time of purchase) on DUOLINGO INC. as long as the price remains well above 225.98 USD. The buyers' bullish objective is set at 234.21 USD. A bullish break in this resistance would boost the bullish momentum. The buyers could then target the resistance located at 239.74 USD. However, beware of bullish excesses that could lead to a possible short-term correction; but this possible correction would not be tradeable.
Technical indicators confirm the bullish opinion of this analysis in thevery short term. However, be careful of excessive bullish movements. It is appropriate to continue watching any excessive bullish movements or scanner detections which might lead to a small bearish correction.
Force
0
10
8.6

Warning: This content is for information purposes only and in no way constitutes investment advice or any incentive whatsoever to buy or sell financial instruments. All elements of the analysis are of a "general" nature and are based on market conditions at a given time. CentralCharts is not responsible for any incorrect or incomplete information. Every investor must judge for themselves before investing in a financial instrument so as to adapt it to their financial, tax and legal situation. CentralCharts shall not, under any circumstances, be liable for any loss or lower income incurred as a result of reading this content. Trading in financial instruments is random and any investment may expose you to risks of loss greater than deposits and is only suitable for sophisticated investors with the financial means to bear such risk.
Additional analysis
Quotes
DUOLINGO INC. rating 229.46 USD. The price has increased by +2.88% since the last closing with the lowest point at 218.68 USD and the highest point at 230.17 USD. The deviation from the price is +4.93% for the low point and -0.31% for the high point.218.68
230.17
229.46
The Central Gaps scanner detects a bullish opening marking the presence of buyers ahead of sellers at the opening but not sufficiently marked to allow the price to register a quotation gap.
Bullish opening
Type : Bullish
Timeframe : Openning
So that you have an overall view of the price change, here is a table showing the variations over several periods:
Near a new HIGH record (5 years)
Type : Bullish
Timeframe : Weekly
Near a new HIGH record (1 month)
Type : Bullish
Timeframe : Weekly
Technical
Technical analysis of DUOLINGO INC. in 1H shows a strongly overall bullish trend. 92.86% of the signals given by moving averages are bullish. The overall trend is supported by the strong bullish signals from short-term moving averages. There is no crossing of moving average by the price or crossing of moving averages between themselves.
In fact, according to the parameters integrated into the Central Analyzer system, 15 technical indicators out of 18 analysed are currently bullish. Caution: the Central Indicators scanner currently detects an excess:
Williams %R indicator is overbought : over -20
Type : Neutral
Timeframe : 1 hour
No signals are given by Central Patterns, a market scanner specialised in chart patterns, resistances and supports.
No result was found by the Central Candlesticks scanner on Japanese candlesticks.
ProTrendLines
S3
S2
S1
R1
R2
R3
Price
| S3 | S2 | S1 | Price | R1 | R2 | R3 | |
|---|---|---|---|---|---|---|---|
| ProTrendLines | 218.63 | 221.97 | 225.98 | 229.46 | 229.84 | 234.21 | 239.74 |
| Change (%) | -4.72% | -3.26% | -1.52% | - | +0.17% | +2.07% | +4.48% |
| Change | -10.83 | -7.49 | -3.48 | - | +0.38 | +4.75 | +10.28 |
| Level | Intermediate | Major | Intermediate | - | Minor | Minor | Major |
Pivot points can also be used to set your price objectives. Here is the price situation in relation to pivot points:
Daily
| Pivot points | S3 | S2 | S1 | PP | R1 | R2 | R3 |
|---|---|---|---|---|---|---|---|
| Standard | 204.06 | 211.41 | 217.22 | 224.57 | 230.38 | 237.73 | 243.54 |
| Camarilla | 219.41 | 220.62 | 221.82 | 223.03 | 224.24 | 225.44 | 226.65 |
| Woodie | 203.29 | 211.03 | 216.45 | 224.19 | 229.61 | 237.35 | 242.77 |
| Fibonacci | 211.41 | 216.44 | 219.54 | 224.57 | 229.60 | 232.70 | 237.73 |
Weekly
| Pivot points | S3 | S2 | S1 | PP | R1 | R2 | R3 |
|---|---|---|---|---|---|---|---|
| Standard | 172.10 | 185.09 | 203.87 | 216.86 | 235.64 | 248.63 | 267.41 |
| Camarilla | 213.92 | 216.84 | 219.75 | 222.66 | 225.57 | 228.49 | 231.40 |
| Woodie | 175.01 | 186.54 | 206.78 | 218.31 | 238.55 | 250.08 | 270.32 |
| Fibonacci | 185.09 | 197.22 | 204.72 | 216.86 | 228.99 | 236.49 | 248.63 |
Monthly
| Pivot points | S3 | S2 | S1 | PP | R1 | R2 | R3 |
|---|---|---|---|---|---|---|---|
| Standard | 161.55 | 177.78 | 201.76 | 217.99 | 241.97 | 258.20 | 282.18 |
| Camarilla | 214.69 | 218.38 | 222.06 | 225.75 | 229.44 | 233.12 | 236.81 |
| Woodie | 165.44 | 179.72 | 205.65 | 219.93 | 245.86 | 260.14 | 286.07 |
| Fibonacci | 177.78 | 193.14 | 202.63 | 217.99 | 233.35 | 242.84 | 258.20 |
Numerical data
The following is the status of technical indicators and moving averages registered at the time this technical analysis was created:
Technical indicators
Moving averages
| RSI (14): | 57.83 | |
| MACD (12,26,9): | 1.2900 | |
| Directional Movement: | 11.87 | |
| AROON (14): | -7.15 | |
| DEMA (21): | 227.23 | |
| Parabolic SAR (0,02-0,02-0,2): | 230.89 | |
| Elder Ray (13): | 3.44 | |
| Super Trend (3,10): | 230.63 | |
| Zig ZAG (10): | 229.80 | |
| VORTEX (21): | 1.0500 | |
| Stochastique (14,3,5): | 75.92 | |
| TEMA (21): | 226.54 | |
| Williams %R (14): | -16.08 | |
| Chande Momentum Oscillator (20): | 8.59 | |
| Repulse (5,40,3): | 1.7800 | |
| ROCnROLL: | 1 | |
| TRIX (15,9): | 0.0600 | |
| Courbe Coppock: | 1.36 |
| MA7: | 223.04 | |
| MA20: | 214.12 | |
| MA50: | 215.74 | |
| MA100: | 210.57 | |
| MAexp7: | 226.96 | |
| MAexp20: | 225.46 | |
| MAexp50: | 222.06 | |
| MAexp100: | 218.76 | |
| Price / MA7: | +2.88% | |
| Price / MA20: | +7.16% | |
| Price / MA50: | +6.36% | |
| Price / MA100: | +8.97% | |
| Price / MAexp7: | +1.10% | |
| Price / MAexp20: | +1.77% | |
| Price / MAexp50: | +3.33% | |
| Price / MAexp100: | +4.89% |
Quotes :
-
15 min delayed data
-
Actions NASDAQ
News
Don't forget to follow the news on DUOLINGO INC.. At the time of publication of this analysis, the latest news was as follows:
- Duolingo to Announce First Quarter 2024 Results on Wednesday, May 8, 2024
- Duolingo Reports 65% DAU Growth, 45% Revenue Growth and Record Profitability in Fourth Quarter 2023
- Duolingo to Announce Fourth Quarter and Full Year 2023 Results on Wednesday, February 28, 2024
- Duolingo Language Report Reveals Changes in Top 10 Languages Studied Around the World
- Duolingo Launches Music and Math on Its Flagship App