Londinia Opportunities Analyses - 05/03/2024 (GMT) EUR/HUF - 1H
- FX/Indices
- Timeframe : 1H
- - Analysis generated on
- Status : INVALID
Summary of the analysis

Additional analysis
Quotes
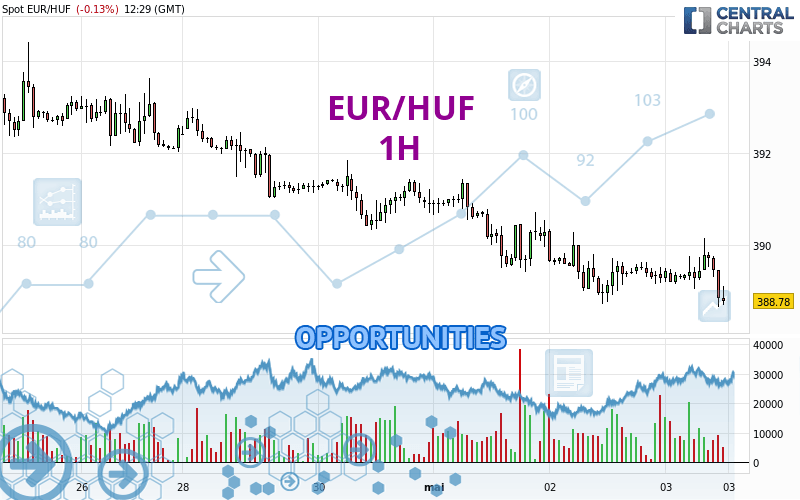
The EUR/HUF rating is 388.85 HUF. The price registered a decrease of -0.11% on the session with the lowest point at 388.66 HUF and the highest point at 390.17 HUF. The deviation from the price is +0.05% for the low point and -0.34% for the high point.The Central Gaps scanner detects a bullish opening. A small advantage for buyers in the very short term.
Bullish opening
Type : Bullish
Timeframe : Openning
A study of price movements over other periods shows the following variations:
Near a new HIGH record (1 year)
Type : Bullish
Timeframe : Weekly
Near a new LOW record (1st january)
Type : Bearish
Timeframe : Weekly
Near a new HIGH record (1 month)
Type : Bullish
Timeframe : Weekly
Technical
A technical analysis in 1H of this EUR/HUF chart shows a sharp bearish trend. 92.86% of the signals given by moving averages are bearish. This strongly bearish trend is supported by the strong bearish signals given by short-term moving averages. The Central Indicators market scanner is currently detecting a bearish signal that could impact this trend:
Bearish trend reversal : adaptative moving average 20
Type : Bearish
Timeframe : 1 hour
Technical indicators are bearish. There is still some doubt about the decline in the price.
But beware of excesses. The Central Indicators scanner currently detects this:
CCI indicator is oversold : under -100
Type : Neutral
Timeframe : 1 hour
Previous candle closed under Bollinger bands
Type : Neutral
Timeframe : 1 hour
Williams %R indicator is oversold : under -80
Type : Neutral
Timeframe : 1 hour
Pivot points : price is under support 3
Type : Neutral
Timeframe : Weekly
MACD crosses DOWN its Moving Average
Type : Bearish
Timeframe : 1 hour
An analysis of the price chart with the Central Patterns scanner (detector of chart patterns and resistances and supports) shows a result that can have an impact on the price change:
Near resistance of channel
Type : Bearish
Timeframe : 1 hour
The Central Candlesticks scanner, specialised in Japanese candlesticks, did not identify any signals.
| S3 | S2 | S1 | Price | R1 | R2 | R3 | |
|---|---|---|---|---|---|---|---|
| ProTrendLines | 385.14 | 387.32 | 388.73 | 388.85 | 389.66 | 391.45 | 392.68 |
| Change (%) | -0.95% | -0.39% | -0.03% | - | +0.21% | +0.67% | +0.98% |
| Change | -3.71 | -1.53 | -0.12 | - | +0.81 | +2.60 | +3.83 |
| Level | Intermediate | Minor | Intermediate | - | Intermediate | Minor | Minor |
Attention could also be paid to pivot points to set price objectives:
| Pivot points | S3 | S2 | S1 | PP | R1 | R2 | R3 |
|---|---|---|---|---|---|---|---|
| Standard | 386.93 | 387.83 | 388.56 | 389.46 | 390.19 | 391.09 | 391.82 |
| Camarilla | 388.84 | 388.99 | 389.14 | 389.29 | 389.44 | 389.59 | 389.74 |
| Woodie | 386.85 | 387.79 | 388.48 | 389.42 | 390.11 | 391.05 | 391.74 |
| Fibonacci | 387.83 | 388.45 | 388.84 | 389.46 | 390.08 | 390.47 | 391.09 |
| Pivot points | S3 | S2 | S1 | PP | R1 | R2 | R3 |
|---|---|---|---|---|---|---|---|
| Standard | 388.48 | 390.26 | 391.40 | 393.18 | 394.32 | 396.10 | 397.24 |
| Camarilla | 391.75 | 392.02 | 392.28 | 392.55 | 392.82 | 393.09 | 393.35 |
| Woodie | 388.17 | 390.10 | 391.09 | 393.02 | 394.01 | 395.94 | 396.93 |
| Fibonacci | 390.26 | 391.37 | 392.06 | 393.18 | 394.29 | 394.98 | 396.10 |
| Pivot points | S3 | S2 | S1 | PP | R1 | R2 | R3 |
|---|---|---|---|---|---|---|---|
| Standard | 379.72 | 384.02 | 387.46 | 391.76 | 395.20 | 399.50 | 402.94 |
| Camarilla | 388.77 | 389.48 | 390.19 | 390.90 | 391.61 | 392.32 | 393.03 |
| Woodie | 379.29 | 383.81 | 387.03 | 391.55 | 394.77 | 399.29 | 402.51 |
| Fibonacci | 384.02 | 386.98 | 388.80 | 391.76 | 394.72 | 396.54 | 399.50 |
Numerical data
The following is the status of technical indicators and moving averages registered at the time this technical analysis was created:
| RSI (14): | 39.20 | |
| MACD (12,26,9): | -0.1000 | |
| Directional Movement: | -2.93 | |
| AROON (14): | -21.43 | |
| DEMA (21): | 389.22 | |
| Parabolic SAR (0,02-0,02-0,2): | 390.14 | |
| Elder Ray (13): | -0.41 | |
| Super Trend (3,10): | 390.19 | |
| Zig ZAG (10): | 388.94 | |
| VORTEX (21): | 0.9400 | |
| Stochastique (14,3,5): | 22.69 | |
| TEMA (21): | 389.29 | |
| Williams %R (14): | -81.46 | |
| Chande Momentum Oscillator (20): | -0.52 | |
| Repulse (5,40,3): | -0.1200 | |
| ROCnROLL: | 2 | |
| TRIX (15,9): | 0.0000 | |
| Courbe Coppock: | 0.04 |
| MA7: | 390.88 | |
| MA20: | 392.12 | |
| MA50: | 393.40 | |
| MA100: | 388.69 | |
| MAexp7: | 389.23 | |
| MAexp20: | 389.36 | |
| MAexp50: | 389.69 | |
| MAexp100: | 390.35 | |
| Price / MA7: | -0.52% | |
| Price / MA20: | -0.83% | |
| Price / MA50: | -1.16% | |
| Price / MA100: | +0.04% | |
| Price / MAexp7: | -0.10% | |
| Price / MAexp20: | -0.13% | |
| Price / MAexp50: | -0.22% | |
| Price / MAexp100: | -0.38% |