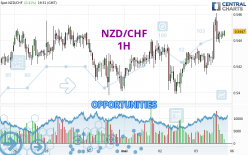
Londinia Opportunities Analyses - 05/03/2024 (GMT) NZD/CHF - 1H
- FX/Indices
- Timeframe : 1H
- - Analysis generated on
- Status : INVALID
Summary of the analysis
Trends
Short term:
Strongly bullish
Underlying:
Strongly bullish
Technical indicators
72%
0%
28%
My opinion
Bullish above 0.5441 CHF
My targets
0.5455 CHF (+0.0007)
0.5461 CHF (+0.0013)
My analysis
NZD/CHF is part of a very strong bullish trend. Traders may consider trading only long positions (at the time of purchase) as long as the price remains well above 0.5441 CHF. The next resistance located at 0.5455 CHF is the next bullish objective to be reached. A bullish break in this resistance would boost the bullish momentum. The bullish movement could then continue towards the next resistance located at 0.5461 CHF. After this resistance, buyers could then target 0.5489 CHF. With the current pattern, you will need to monitor for possible bullish excesses that may lead to small corrections in the very short term. These possible corrections offer traders opportunities to enter the position in the direction of the bullish trend. Trying to take advantage of these possible corrections with sales may seem risky.
In the very short term, the general bullish sentiment is confirmed by technical indicators. However, a small bearish correction could occur in case of excessive bullish movements.
Force
0
10
8.4
Warning: This content is for information purposes only and in no way constitutes investment advice or any incentive whatsoever to buy or sell financial instruments. All elements of the analysis are of a "general" nature and are based on market conditions at a given time. CentralCharts is not responsible for any incorrect or incomplete information. Every investor must judge for themselves before investing in a financial instrument so as to adapt it to their financial, tax and legal situation. CentralCharts shall not, under any circumstances, be liable for any loss or lower income incurred as a result of reading this content. Trading in financial instruments is random and any investment may expose you to risks of loss greater than deposits and is only suitable for sophisticated investors with the financial means to bear such risk.
Additional analysis
Quotes
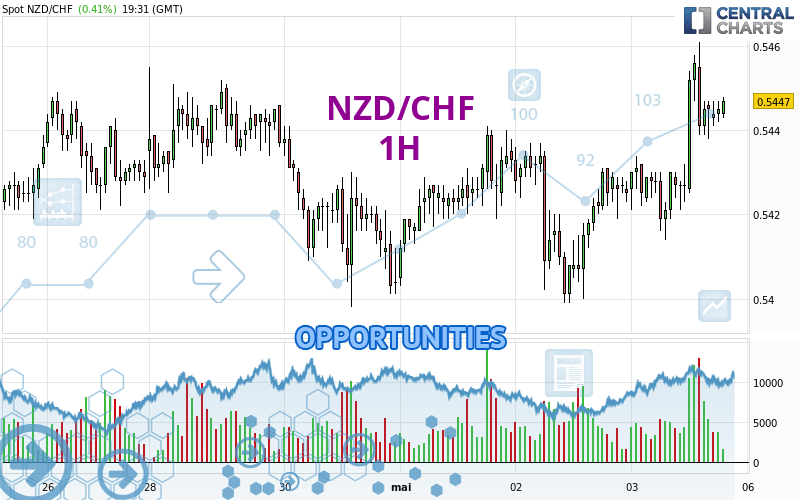
NZD/CHF rating 0.5448 CHF. The price has increased by +0.42% since the last closing and was between 0.5414 CHF and 0.5461 CHF. This implies that the price is at +0.63% from its lowest and at -0.24% from its highest.0.5414
0.5461
0.5448
A bullish opening was detected by the Central Gaps scanner. Buyers are trying to impose a bullish momentum in the very short term.
Bullish opening
Type : Bullish
Timeframe : Openning
A study of price movements over other periods shows the following variations:
Near a new LOW record (5 years)
Type : Bearish
Timeframe : Weekly
Near a new LOW record (1 year)
Type : Bearish
Timeframe : Weekly
Near a new LOW record (1st january)
Type : Bearish
Timeframe : Weekly
Near a new LOW record (1 month)
Type : Bearish
Timeframe : Weekly
Technical
Technical analysis of this 1H chart of NZD/CHF indicates that the overall trend is strongly bullish. The signals given by the moving averages are 92.86% bullish. This strong bullish trend is confirmed by the strong signals currently being given by short-term moving averages. There is no crossing of moving average by the price or crossing of moving averages between themselves.
Technical indicators are strongly bullish, suggesting that the price increase should continue.
Central Indicators, the scanner specialised in technical indicators, has identified this signal:
Pivot points : price is over resistance 1
Type : Neutral
Timeframe : 1 hour
An analysis of the price chart with the Central Patterns scanner (detector of chart patterns and resistances and supports) shows several results that can have an impact on the price change:
Near horizontal resistance
Type : Bearish
Timeframe : 1 hour
Resistance of channel is broken
Type : Bullish
Timeframe : 1 hour
The Central Candlesticks scanner which studies Japanese candlesticks did not detect anything.
ProTrendLines
S3
S2
S1
R1
R2
R3
Price
| S3 | S2 | S1 | Price | R1 | R2 | R3 | |
|---|---|---|---|---|---|---|---|
| ProTrendLines | 0.5431 | 0.5441 | 0.5447 | 0.5448 | 0.5455 | 0.5461 | 0.5489 |
| Change (%) | -0.31% | -0.13% | -0.02% | - | +0.13% | +0.24% | +0.75% |
| Change | -0.0017 | -0.0007 | -0.0001 | - | +0.0007 | +0.0013 | +0.0041 |
| Level | Intermediate | Minor | Minor | - | Minor | Minor | Intermediate |
Attention could also be paid to pivot points to set price objectives:
Daily
| Pivot points | S3 | S2 | S1 | PP | R1 | R2 | R3 |
|---|---|---|---|---|---|---|---|
| Standard | 0.5366 | 0.5382 | 0.5404 | 0.5420 | 0.5442 | 0.5458 | 0.5480 |
| Camarilla | 0.5415 | 0.5418 | 0.5422 | 0.5425 | 0.5429 | 0.5432 | 0.5436 |
| Woodie | 0.5368 | 0.5384 | 0.5406 | 0.5422 | 0.5444 | 0.5460 | 0.5482 |
| Fibonacci | 0.5382 | 0.5397 | 0.5406 | 0.5420 | 0.5435 | 0.5444 | 0.5458 |
Weekly
| Pivot points | S3 | S2 | S1 | PP | R1 | R2 | R3 |
|---|---|---|---|---|---|---|---|
| Standard | 0.5282 | 0.5320 | 0.5374 | 0.5412 | 0.5466 | 0.5504 | 0.5558 |
| Camarilla | 0.5404 | 0.5412 | 0.5421 | 0.5429 | 0.5437 | 0.5446 | 0.5454 |
| Woodie | 0.5291 | 0.5324 | 0.5383 | 0.5416 | 0.5475 | 0.5508 | 0.5567 |
| Fibonacci | 0.5320 | 0.5355 | 0.5377 | 0.5412 | 0.5447 | 0.5469 | 0.5504 |
Monthly
| Pivot points | S3 | S2 | S1 | PP | R1 | R2 | R3 |
|---|---|---|---|---|---|---|---|
| Standard | 0.5076 | 0.5179 | 0.5291 | 0.5394 | 0.5506 | 0.5609 | 0.5721 |
| Camarilla | 0.5345 | 0.5365 | 0.5384 | 0.5404 | 0.5424 | 0.5443 | 0.5463 |
| Woodie | 0.5082 | 0.5181 | 0.5297 | 0.5396 | 0.5512 | 0.5611 | 0.5727 |
| Fibonacci | 0.5179 | 0.5261 | 0.5312 | 0.5394 | 0.5476 | 0.5527 | 0.5609 |
Numerical data
The following is the status of the technical indicators and moving averages at the time of publication of this technical analysis:
Technical indicators
Moving averages
| RSI (14): | 59.37 | |
| MACD (12,26,9): | 0.0006 | |
| Directional Movement: | 6.0530 | |
| AROON (14): | 50.0000 | |
| DEMA (21): | 0.5444 | |
| Parabolic SAR (0,02-0,02-0,2): | 0.5437 | |
| Elder Ray (13): | 0.0005 | |
| Super Trend (3,10): | 0.5421 | |
| Zig ZAG (10): | 0.5446 | |
| VORTEX (21): | 1.0905 | |
| Stochastique (14,3,5): | 65.25 | |
| TEMA (21): | 0.5448 | |
| Williams %R (14): | -34.04 | |
| Chande Momentum Oscillator (20): | 0.0024 | |
| Repulse (5,40,3): | 0.0461 | |
| ROCnROLL: | 1 | |
| TRIX (15,9): | 0.0128 | |
| Courbe Coppock: | 0.65 |
| MA7: | 0.5430 | |
| MA20: | 0.5421 | |
| MA50: | 0.5410 | |
| MA100: | 0.5374 | |
| MAexp7: | 0.5444 | |
| MAexp20: | 0.5437 | |
| MAexp50: | 0.5430 | |
| MAexp100: | 0.5427 | |
| Price / MA7: | +0.33% | |
| Price / MA20: | +0.50% | |
| Price / MA50: | +0.70% | |
| Price / MA100: | +1.38% | |
| Price / MAexp7: | +0.07% | |
| Price / MAexp20: | +0.20% | |
| Price / MAexp50: | +0.33% | |
| Price / MAexp100: | +0.39% |
Quotes :
-
Real time data
-
Forex
News
Don't forget to follow the news on NZD/CHF. At the time of publication of this analysis, the latest news was as follows: