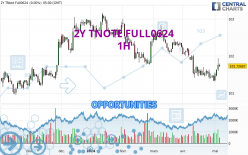
Londinia Opportunities Analyses - 05/07/2024 (GMT) 2Y TNOTE FULL0924 - 1H
-
USD
(-)
-
10 min delayed data - CBOT Futures
| Type: | Futures |
| Ticker: | ZTXXXX |
| ISIN: | ZTXXXX |
- FX/Indices
- Timeframe : 1H
- - Analysis generated on
- Status : INVALID
Summary of the analysis
Trends
Short term:
Bullish
Underlying:
Strongly bullish
Technical indicators
78%
6%
17%
My opinion
Bullish above 101.71953 USD
My targets
101.79297 USD (+0.04%)
101.94141 USD (+0.19%)
My analysis
The basic bullish trend is very strong on 2Y TNOTE FULL0624 but the short term shows some signs of running out of steam. However, a purchase could be considered as long as the price remains above 101.71953 USD. Crossing the first resistance at 101.79297 USD would be a sign of a potential new surge in the price. Buyers would then use the next resistance located at 101.94141 USD as an objective. Crossing it would then enable buyers to target 102.58984 USD. Caution, a return to below 101.71953 USD would be a sign of a consolidation phase in the short-term basic trend. If this is the case, remember that trading against the trend may be riskier. It would seem more appropriate to wait for a signal indicating reversal of the trend.
In the very short term, the general bullish sentiment is confirmed by technical indicators. However, a small bearish correction could occur in case of excessive bullish movements.
Force
0
10
7.7

Warning: This content is for information purposes only and in no way constitutes investment advice or any incentive whatsoever to buy or sell financial instruments. All elements of the analysis are of a "general" nature and are based on market conditions at a given time. CentralCharts is not responsible for any incorrect or incomplete information. Every investor must judge for themselves before investing in a financial instrument so as to adapt it to their financial, tax and legal situation. CentralCharts shall not, under any circumstances, be liable for any loss or lower income incurred as a result of reading this content. Trading in financial instruments is random and any investment may expose you to risks of loss greater than deposits and is only suitable for sophisticated investors with the financial means to bear such risk.
Additional analysis
Quotes
2Y TNOTE FULL0624 rating 101.75000 USD. The price has increased by +0.02% since the last closing with the lowest point at 101.69531 USD and the highest point at 101.76172 USD. The deviation from the price is +0.05% for the low point and -0.01% for the high point.101.69531
101.76172
101.75000
The Central Gaps scanner detects a bearish opening. A small advantage for sellers in the very short term.
Bearish opening
Type : Bearish
Timeframe : Openning
Here is a more detailed summary of the historical variations registered by 2Y TNOTE FULL0624:
Near a new LOW record (5 years)
Type : Bearish
Timeframe : Weekly
Near a new HIGH record (1 year)
Type : Bullish
Timeframe : Weekly
Near a new HIGH record (1st january)
Type : Bullish
Timeframe : Weekly
Near a new HIGH record (1 month)
Type : Bullish
Timeframe : Weekly
Technical
A technical analysis in 1H of this 2Y TNOTE FULL0624 chart shows a strongly bullish trend. The signals given by moving averages are 89.29% bullish. This strongly bullish trend seems to be running out of steam given the signals being given by short-term moving averages. The Central Indicators scanner does not detect any result on moving averages that would impact this trend.
In fact, 14 technical indicators on 18 studied are currently bullish. Caution: the Central Indicators scanner currently detects an excess:
Williams %R indicator is overbought : over -20
Type : Neutral
Timeframe : 1 hour
The analysis of the price chart with Central Patterns scanners does not return any result.
The Central Candlesticks scanner which studies Japanese candlesticks did not detect anything.
ProTrendLines
S3
S2
S1
R1
R2
R3
Price
| S3 | S2 | S1 | Price | R1 | R2 | R3 | |
|---|---|---|---|---|---|---|---|
| ProTrendLines | 101.48203 | 101.60156 | 101.71953 | 101.75000 | 101.79297 | 101.94141 | 102.58984 |
| Change (%) | -0.26% | -0.15% | -0.03% | - | +0.04% | +0.19% | +0.83% |
| Change | -0.26797 | -0.14844 | -0.03047 | - | +0.04297 | +0.19141 | +0.83984 |
| Level | Intermediate | Major | Minor | - | Intermediate | Major | Intermediate |
Pivot points can also be used to set your price objectives. Here is the price situation in relation to pivot points:
Daily
| Pivot points | S3 | S2 | S1 | PP | R1 | R2 | R3 |
|---|---|---|---|---|---|---|---|
| Standard | 101.59896 | 101.65105 | 101.68880 | 101.74089 | 101.77864 | 101.83073 | 101.86848 |
| Camarilla | 101.70185 | 101.71009 | 101.71833 | 101.72656 | 101.73480 | 101.74303 | 101.75127 |
| Woodie | 101.59180 | 101.64747 | 101.68164 | 101.73731 | 101.77148 | 101.82715 | 101.86132 |
| Fibonacci | 101.65105 | 101.68537 | 101.70657 | 101.74089 | 101.77521 | 101.79641 | 101.83073 |
Weekly
| Pivot points | S3 | S2 | S1 | PP | R1 | R2 | R3 |
|---|---|---|---|---|---|---|---|
| Standard | 100.77474 | 101.04166 | 101.39974 | 101.66666 | 102.02474 | 102.29166 | 102.64974 |
| Camarilla | 101.58594 | 101.64323 | 101.70052 | 101.75781 | 101.81510 | 101.87239 | 101.92969 |
| Woodie | 100.82031 | 101.06445 | 101.44531 | 101.68945 | 102.07031 | 102.31445 | 102.69531 |
| Fibonacci | 101.04166 | 101.28041 | 101.42791 | 101.66666 | 101.90541 | 102.05291 | 102.29166 |
Monthly
| Pivot points | S3 | S2 | S1 | PP | R1 | R2 | R3 |
|---|---|---|---|---|---|---|---|
| Standard | 100.24088 | 100.77473 | 101.14323 | 101.67708 | 102.04558 | 102.57943 | 102.94793 |
| Camarilla | 101.26357 | 101.34629 | 101.42901 | 101.51172 | 101.59444 | 101.67715 | 101.75987 |
| Woodie | 100.15820 | 100.73339 | 101.06055 | 101.63574 | 101.96290 | 102.53809 | 102.86525 |
| Fibonacci | 100.77473 | 101.11943 | 101.33239 | 101.67708 | 102.02178 | 102.23474 | 102.57943 |
Numerical data
The following is the status of the technical indicators and moving averages at the time of publication of this technical analysis:
Technical indicators
Moving averages
| RSI (14): | 56.65 | |
| MACD (12,26,9): | 0.0041 | |
| Directional Movement: | 8.83132 | |
| AROON (14): | 57.14286 | |
| DEMA (21): | 101.73904 | |
| Parabolic SAR (0,02-0,02-0,2): | 101.69794 | |
| Elder Ray (13): | 0.01277 | |
| Super Trend (3,10): | 101.76696 | |
| Zig ZAG (10): | 101.75000 | |
| VORTEX (21): | 0.9626 | |
| Stochastique (14,3,5): | 84.31 | |
| TEMA (21): | 101.73035 | |
| Williams %R (14): | -17.65 | |
| Chande Momentum Oscillator (20): | 0.03906 | |
| Repulse (5,40,3): | 0.0190 | |
| ROCnROLL: | 1 | |
| TRIX (15,9): | 0.0000 | |
| Courbe Coppock: | 0.00 |
| MA7: | 101.59487 | |
| MA20: | 101.55820 | |
| MA50: | 102.00133 | |
| MA100: | 102.51809 | |
| MAexp7: | 101.73909 | |
| MAexp20: | 101.73337 | |
| MAexp50: | 101.70509 | |
| MAexp100: | 101.64300 | |
| Price / MA7: | +0.15% | |
| Price / MA20: | +0.19% | |
| Price / MA50: | -0.25% | |
| Price / MA100: | -0.75% | |
| Price / MAexp7: | +0.01% | |
| Price / MAexp20: | +0.02% | |
| Price / MAexp50: | +0.04% | |
| Price / MAexp100: | +0.11% |
Quotes :
-
10 min delayed data
-
Futures CBOT