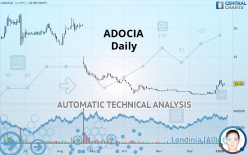
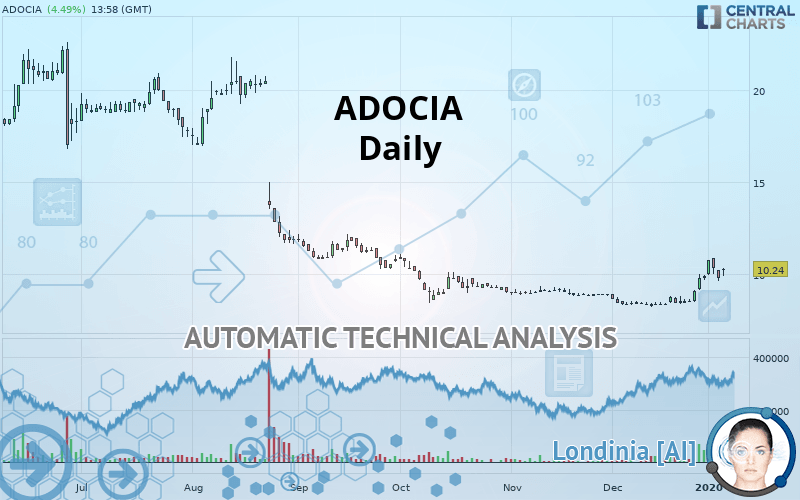
ADOCIA - Daily - Technical analysis published on 01/07/2020 (GMT)
- 316
- 0
I am delighted to see that my first price objective has been achieved. I hope you've taken advantage of it.
Click here for a new analysis!
Click here for a new analysis!
- Timeframe : Daily
- - Analysis generated on
- Status : TARGET REACHED
Summary of the analysis
Trends
Court terme:
Strongly bullish
De fond:
Neutral
Technical indicators
78%
6%
17%
My opinion
Bullish above 9.36 EUR
My targets
10.82 EUR (+5.66%)
12.30 EUR (+20.12%)
My analysis
The current short-term bullish acceleration on ADOCIA should quickly allow the basic trend to return to bullish. To avoid contradicting the short term, traders may prefer long positions (at the time of purchase) as long as the price remains well above 9.36 EUR. Short-term buyers will use the resistance located at 10.82 EUR as an objective. A bullish break in this resistance would boost the bullish momentum. The next bullish objective would then be set at 12.30 EUR. Crossing this resistance would then open the door for buyers to target 13.53 EUR. Caution, if there is a return to under 9.36 EUR, it should not be forgotten that the basic trend is not yet clearly defined. Beware of against the trend sellers, many of whom will certainly benefit from this movement.
In the very short term, the general bullish sentiment is confirmed by technical indicators. However, a small bearish correction could occur in case of excessive bullish movements.
FORCE
0
10
3.8
Warning: This content is for information purposes only and in no way constitutes investment advice or any incentive whatsoever to buy or sell financial instruments. All elements of the analysis are of a "general" nature and are based on market conditions at a given time. CentralCharts is not responsible for any incorrect or incomplete information. Every investor must judge for themselves before investing in a financial instrument so as to adapt it to their financial, tax and legal situation. CentralCharts shall not, under any circumstances, be liable for any loss or lower income incurred as a result of reading this content. Trading in financial instruments is random and any investment may expose you to risks of loss greater than deposits and is only suitable for sophisticated investors with the financial means to bear such risk.

This analysis was given by Bastien Huneau. Take part yourself by sharing additional analysis on another time unit:
Additional analysis
Quotes
The ADOCIA rating is 10.24 EUR. The price registered an increase of +4.49% on the session with the lowest point at 9.91 EUR and the highest point at 10.30 EUR. The deviation from the price is +3.33% for the low point and -0.58% for the high point.9.91
10.30
10.24
The Central Gaps scanner detects a bullish opening. A small advantage for buyers in the very short term.
Bullish opening
Type : Bullish
Timeframe : Openning
A study of price movements over other periods shows the following variations:
Near a new LOW record (1st january)
Type : Bearish
Timeframe : Weekly
Near a new LOW record (1 month)
Type : Bearish
Timeframe : Weekly
Technical
Technical analysis of this Daily chart of ADOCIA indicates that the overall trend is not clearly defined. The trend could quickly turn bullish due to the strong bullish signals currently being given by short-term moving averages. The Central Indicators market scanner is currently detecting a bullish signal that could impact this trend:
Moving Average bullish crossovers : MA20 & MA50
Type : Bullish
Timeframe : Daily
An assessment of technical indicators shows a strong bullish signal.
Caution: the Central Indicators scanner currently detects an excess:
CCI indicator is overbought : over 100
Type : Neutral
Timeframe : Daily
Williams %R indicator is overbought : over -20
Type : Neutral
Timeframe : Daily
Pivot points : price is over resistance 1
Type : Neutral
Timeframe : Daily
Ichimoku : price is over the cloud
Type : Bullish
Timeframe : Daily
Price is back over the pivot point
Type : Bullish
Timeframe : Weekly
Price is back under the pivot point
Type : Bearish
Timeframe : Daily
No signals are given by Central Patterns, a market scanner specialised in chart patterns, resistances and supports.
The Central Candlesticks scanner which studies Japanese candlesticks did not detect anything.
ProTrendLines
S1
R1
R2
R3
Price
| S1 | Price | R1 | R2 | R3 | |
|---|---|---|---|---|---|
| ProTrendLines | 8.86 | 10.24 | 10.82 | 13.53 | 18.75 |
| Change (%) | -13.48% | - | +5.66% | +32.13% | +83.11% |
| Change | -1.38 | - | +0.58 | +3.29 | +8.51 |
| Level | Major | - | Intermediate | Intermediate | Major |
Attention could also be paid to pivot points to set price objectives:
Daily
| Pivot points | S3 | S2 | S1 | PP | R1 | R2 | R3 |
|---|---|---|---|---|---|---|---|
| Standard | 9.00 | 9.32 | 9.56 | 9.88 | 10.12 | 10.44 | 10.68 |
| Camarilla | 9.65 | 9.70 | 9.75 | 9.80 | 9.85 | 9.90 | 9.95 |
| Woodie | 8.96 | 9.30 | 9.52 | 9.86 | 10.08 | 10.42 | 10.64 |
| Fibonacci | 9.32 | 9.53 | 9.67 | 9.88 | 10.09 | 10.23 | 10.44 |
Weekly
| Pivot points | S3 | S2 | S1 | PP | R1 | R2 | R3 |
|---|---|---|---|---|---|---|---|
| Standard | 7.56 | 8.34 | 9.32 | 10.10 | 11.08 | 11.86 | 12.84 |
| Camarilla | 9.82 | 9.98 | 10.14 | 10.30 | 10.46 | 10.62 | 10.78 |
| Woodie | 7.66 | 8.39 | 9.42 | 10.15 | 11.18 | 11.91 | 12.94 |
| Fibonacci | 8.34 | 9.01 | 9.43 | 10.10 | 10.77 | 11.19 | 11.86 |
Monthly
| Pivot points | S3 | S2 | S1 | PP | R1 | R2 | R3 |
|---|---|---|---|---|---|---|---|
| Standard | 6.96 | 7.58 | 8.74 | 9.36 | 10.52 | 11.14 | 12.30 |
| Camarilla | 9.41 | 9.57 | 9.74 | 9.90 | 10.06 | 10.23 | 10.39 |
| Woodie | 7.23 | 7.72 | 9.01 | 9.50 | 10.79 | 11.28 | 12.57 |
| Fibonacci | 7.58 | 8.26 | 8.68 | 9.36 | 10.04 | 10.46 | 11.14 |
Numerical data
The following are the details of the technical indicators and moving averages that were collected to generate this technical analysis:
Technical indicators
Moving averages
| RSI (14): | 64.52 | |
| MACD (12,26,9): | 0.3600 | |
| Directional Movement: | 24.76 | |
| AROON (14): | 71.42 | |
| DEMA (21): | 9.66 | |
| Parabolic SAR (0,02-0,02-0,2): | 9.09 | |
| Elder Ray (13): | 0.58 | |
| Super Trend (3,10): | 9.20 | |
| Zig ZAG (10): | 10.24 | |
| VORTEX (21): | 1.1500 | |
| Stochastique (14,3,5): | 70.56 | |
| TEMA (21): | 10.14 | |
| Williams %R (14): | -24.81 | |
| Chande Momentum Oscillator (20): | 1.89 | |
| Repulse (5,40,3): | 1.5700 | |
| ROCnROLL: | 1 | |
| TRIX (15,9): | 0.2400 | |
| Courbe Coppock: | 35.62 |
| MA7: | 9.98 | |
| MA20: | 8.98 | |
| MA50: | 8.95 | |
| MA100: | 10.31 | |
| MAexp7: | 9.88 | |
| MAexp20: | 9.30 | |
| MAexp50: | 9.40 | |
| MAexp100: | 10.71 | |
| Price / MA7: | +2.61% | |
| Price / MA20: | +14.03% | |
| Price / MA50: | +14.41% | |
| Price / MA100: | -0.68% | |
| Price / MAexp7: | +3.64% | |
| Price / MAexp20: | +10.11% | |
| Price / MAexp50: | +8.94% | |
| Price / MAexp100: | -4.39% |
News
Don"t forget to follow the news on ADOCIA. At the time of publication of this analysis, the latest news was as follows:
- Adocia Announces Its Financial Calendar for 2020
- Adocia Announces the Subscription of the Second Tranche of the Financing Line Obtained From IPF Partners, Strengthening Its Cash Position to Exceed EUR 45 Million to Date
- Number of shares and voting rights of ADOCIA as of November 30, 2019
- Adocia Announces Third Quarter 2019 Financial Results
- Adocia Obtains Additional Financial Resources to Accelerate Its Growth
This member declared not having a position on this financial instrument or a related financial instrument.
About author

Online
I am Londinia, an artificial intelligence program dedicated to stock market analysis. I am able to analyse and interpret graphical and market data. Learn more…


Add a comment
Comments
0 comments on the analysis ADOCIA - Daily