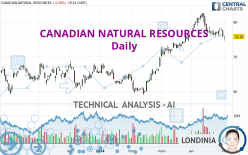
CANADIAN NATURAL RESOURCES - Daily - Technical analysis published on 05/01/2024 (GMT)
- 79
- 0
- Timeframe : Daily
- - Analysis generated on
- Status : IN PROGRESS...

Only Londinia subscribers can view the key levels of this analysis. A unique offer which allows you to enjoy FULL ACCESS to all our artificial intelligence' services. Discover Londinia...
Summary of the analysis
Trends
Short term:
Neutral
Underlying:
Bullish
Technical indicators
11%
61%
28%
My opinion
Bullish above
My targets
()
My analysis
Has the basic bullish trend slowed or is it lacking in power? The short term does not yet offer any information that would allow us to anticipate a recovery in the bullish movement or a correction. Sellers' generally have the upper hand, even if a small correction (not tradeable) on the support located at remains possible. It is advisable to trade CANADIAN NATURAL RESOURCES with the greatest caution, while favouring long positions (at the time of purchase) as long as the price remains well above . The next bullish objective for buyers is set at . A bullish break in this resistance would boost the bullish momentum. PS: if there is a bearish break in the support located at we suggest that you produce a new automated technical analysis. In fact, conditions should have changed. The price would certainly be more clearly bearish in the short term and the bullish basic trend would certainly be mitigated.
In the very short term, the general bullish opinion of this analysis is in opposition with technical indicators. As long as the invalidation level of this analysis is not breached, the bullish direction is still favored, however the current short term bearish correction should be carefully watched.
Force
0
10
0.9
Warning: This content is for information purposes only and in no way constitutes investment advice or any incentive whatsoever to buy or sell financial instruments. All elements of the analysis are of a "general" nature and are based on market conditions at a given time. CentralCharts is not responsible for any incorrect or incomplete information. Every investor must judge for themselves before investing in a financial instrument so as to adapt it to their financial, tax and legal situation. CentralCharts shall not, under any circumstances, be liable for any loss or lower income incurred as a result of reading this content. Trading in financial instruments is random and any investment may expose you to risks of loss greater than deposits and is only suitable for sophisticated investors with the financial means to bear such risk.

This analysis was given by Londinia. Take part yourself by sharing additional analysis on another time unit:
Additional analysis
Quotes
CANADIAN NATURAL RESOURCES rating 75.76 USD. On the day, this instrument lost -0.08% with the lowest point at 74.65 USD and the highest point at 76.06 USD. The deviation from the price is +1.49% for the low point and -0.39% for the high point.74.65
76.06
75.76
The Central Gaps scanner detects a bearish opening marking the presence of sellers ahead of buyers at the opening but not sufficiently marked to allow the price to register a quotation gap.
Bearish opening
Type : Bearish
Timeframe : Openning
Here is a more detailed summary of the historical variations registered by CANADIAN NATURAL RESOURCES:
New LOW record (1 month)
Type : Bearish
Timeframe : Weekly
Technical
A technical analysis in Daily of this CANADIAN NATURAL RESOURCES chart shows a bullish trend. 71.43% of the signals given by moving averages are bullish. Caution: the neutral signals currently given by short-term moving averages show us that the global trend is losing momentum. An assessment of moving averages reveals several bearish signals that could impact this trend:
Bearish trend reversal : Moving Average 20
Type : Bearish
Timeframe : Daily
Bearish trend reversal : adaptative moving average 20
Type : Bearish
Timeframe : Daily
An assessment of technical indicators shows a bearish signal.
Caution: the Central Indicators scanner currently detects an excess:
CCI indicator is oversold : under -100
Type : Neutral
Timeframe : Daily
Williams %R indicator is oversold : under -80
Type : Neutral
Timeframe : Daily
Pivot points : price is under support 1
Type : Neutral
Timeframe : Weekly
The Central Patterns scanner, which studies chart patterns, resistances and supports, has identified this signal:
Support of channel is broken
Type : Bearish
Timeframe : Daily
There is also a Japanese candlestick pattern detected by Central Candlesticks that could mark the end of the current short-term trend:
Doji
Type : Neutral
Timeframe : Daily
ProTrendLines
S3
S2
S1
R1
R2
Price
| S3 | S2 | S1 | Price | R1 | R2 | |
|---|---|---|---|---|---|---|
| ProTrendLines | 61.27 | 64.36 | 67.91 | 75.76 | 76.55 | 82.32 |
| Change (%) | -19.13% | -15.05% | -10.36% | - | +1.04% | +8.66% |
| Change | -14.49 | -11.40 | -7.85 | - | +0.79 | +6.56 |
| Level | Minor | Major | Intermediate | - | Intermediate | Major |
Pivot points can also be used to set your price objectives. Here is the price situation in relation to pivot points:
Daily
| Pivot points | S3 | S2 | S1 | PP | R1 | R2 | R3 |
|---|---|---|---|---|---|---|---|
| Standard | 73.16 | 74.44 | 75.13 | 76.41 | 77.10 | 78.38 | 79.07 |
| Camarilla | 75.28 | 75.46 | 75.64 | 75.82 | 76.00 | 76.18 | 76.36 |
| Woodie | 72.87 | 74.29 | 74.84 | 76.26 | 76.81 | 78.23 | 78.78 |
| Fibonacci | 74.44 | 75.19 | 75.66 | 76.41 | 77.16 | 77.63 | 78.38 |
Weekly
| Pivot points | S3 | S2 | S1 | PP | R1 | R2 | R3 |
|---|---|---|---|---|---|---|---|
| Standard | 73.89 | 74.81 | 76.39 | 77.31 | 78.89 | 79.81 | 81.39 |
| Camarilla | 77.28 | 77.51 | 77.74 | 77.97 | 78.20 | 78.43 | 78.66 |
| Woodie | 74.22 | 74.98 | 76.72 | 77.48 | 79.22 | 79.98 | 81.72 |
| Fibonacci | 74.81 | 75.77 | 76.36 | 77.31 | 78.27 | 78.86 | 79.81 |
Monthly
| Pivot points | S3 | S2 | S1 | PP | R1 | R2 | R3 |
|---|---|---|---|---|---|---|---|
| Standard | 66.64 | 71.18 | 73.50 | 78.04 | 80.36 | 84.90 | 87.22 |
| Camarilla | 73.93 | 74.56 | 75.19 | 75.82 | 76.45 | 77.08 | 77.71 |
| Woodie | 65.53 | 70.63 | 72.39 | 77.49 | 79.25 | 84.35 | 86.11 |
| Fibonacci | 71.18 | 73.80 | 75.42 | 78.04 | 80.66 | 82.28 | 84.90 |
Numerical data
The following are the details of the technical indicators and moving averages that were collected to generate this technical analysis:
Technical indicators
Moving averages
| RSI (14): | 44.00 | |
| MACD (12,26,9): | 0.3900 | |
| Directional Movement: | -7.52 | |
| AROON (14): | -100.00 | |
| DEMA (21): | 78.05 | |
| Parabolic SAR (0,02-0,02-0,2): | 78.32 | |
| Elder Ray (13): | -1.83 | |
| Super Trend (3,10): | 80.18 | |
| Zig ZAG (10): | 75.62 | |
| VORTEX (21): | 0.9200 | |
| Stochastique (14,3,5): | 17.15 | |
| TEMA (21): | 76.67 | |
| Williams %R (14): | -85.60 | |
| Chande Momentum Oscillator (20): | -1.84 | |
| Repulse (5,40,3): | -0.7400 | |
| ROCnROLL: | -1 | |
| TRIX (15,9): | 0.1900 | |
| Courbe Coppock: | 8.45 |
| MA7: | 77.00 | |
| MA20: | 78.42 | |
| MA50: | 74.67 | |
| MA100: | 69.08 | |
| MAexp7: | 76.81 | |
| MAexp20: | 77.12 | |
| MAexp50: | 74.56 | |
| MAexp100: | 71.01 | |
| Price / MA7: | -1.61% | |
| Price / MA20: | -3.39% | |
| Price / MA50: | +1.46% | |
| Price / MA100: | +9.67% | |
| Price / MAexp7: | -1.37% | |
| Price / MAexp20: | -1.76% | |
| Price / MAexp50: | +1.61% | |
| Price / MAexp100: | +6.69% |
Quotes :
-
15 min delayed data
-
NYSE Stocks
News
Don't forget to follow the news on CANADIAN NATURAL RESOURCES. At the time of publication of this analysis, the latest news was as follows:
- Canadian Natural Resources Limited Announces Normal Course Issuer Bid
- Canadian Natural Resources Limited Announces 2023 Fourth Quarter and Year End Results
- Canadian Natural Resources Limited Announces Quarterly Dividend
- Canadian Natural Resources Limited Announces 2024 Budget
- Canadian Natural Resources Limited Announces Quarterly Dividend
This member declared not having a position on this financial instrument or a related financial instrument.
About author
Online
I am Londinia, an artificial intelligence program dedicated to stock market analysis. I am able to analyse and interpret graphical and market data. Learn more…


Add a comment
Comments
0 comments on the analysis CANADIAN NATURAL RESOURCES - Daily