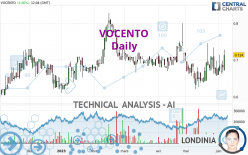
VOCENTO - Daily - Technical analysis published on 06/07/2023 (GMT)
- 93
- 0
Click here for a new analysis!
- Timeframe : Daily
- - Analysis generated on
- Status : INVALID

Summary of the analysis

Additional analysis
Quotes
The VOCENTO price is 0.714 EUR. The price registered an increase of +5.00% on the session and was between 0.672 EUR and 0.728 EUR. This implies that the price is at +6.25% from its lowest and at -1.92% from its highest.The Central Gaps scanner detects a bearish opening. A small advantage for sellers in the very short term.
Bearish opening
Type : Bearish
Timeframe : Openning
So that you have an overall view of the price change, here is a table showing the variations over several periods:
Near a new HIGH record (1 month)
Type : Bullish
Timeframe : Weekly
Technical
Technical analysis of this Daily chart of VOCENTO indicates that the overall trend is strongly bullish. 92.86% of the signals given by moving averages are bullish. This strongly bullish trend is supported by the strong bullish signals given by short-term moving averages. The Central Indicators market scanner is currently detecting a bullish signal that could impact this trend:
Bullish trend reversal : adaptative moving average 20
Type : Bullish
Timeframe : Daily
In fact, 13 technical indicators on 18 studied are currently bullish. Caution: the Central Indicators scanner currently detects an excess:
CCI indicator is overbought : over 100
Type : Neutral
Timeframe : Daily
Pivot points : price is over resistance 2
Type : Neutral
Timeframe : Daily
MACD crosses UP its Moving Average
Type : Bullish
Timeframe : Daily
Ichimoku : price is over the cloud
Type : Bullish
Timeframe : Daily
Price is back over the pivot point
Type : Bullish
Timeframe : Weekly
Williams %R indicator is back over -50
Type : Bullish
Timeframe : Daily
An analysis of the price chart with the Central Patterns scanner (detector of chart patterns and resistances and supports) shows several results that can have an impact on the price change:
Near resistance of channel
Type : Bearish
Timeframe : Daily
Horizontal resistance is broken
Type : Bullish
Timeframe : Daily
For a small rebound in the very short term, the Central Candlesticks scanner currently notes the presence of this bullish pattern in Japanese candlesticks:
Bullish engulfing lines
Type : Bullish
Timeframe : Daily
| S3 | S2 | S1 | Price | R1 | R2 | R3 | |
|---|---|---|---|---|---|---|---|
| ProTrendLines | 0.632 | 0.670 | 0.688 | 0.714 | 0.718 | 0.758 | 0.999 |
| Change (%) | -11.48% | -6.16% | -3.64% | - | +0.56% | +6.16% | +39.92% |
| Change | -0.082 | -0.044 | -0.026 | - | +0.004 | +0.044 | +0.285 |
| Level | Intermediate | Intermediate | Minor | - | Intermediate | Intermediate | Intermediate |
Pivot points can also be used to set your price objectives. Here is the price situation in relation to pivot points:
| Pivot points | S3 | S2 | S1 | PP | R1 | R2 | R3 |
|---|---|---|---|---|---|---|---|
| Standard | 0.633 | 0.649 | 0.665 | 0.681 | 0.697 | 0.713 | 0.729 |
| Camarilla | 0.671 | 0.674 | 0.677 | 0.680 | 0.683 | 0.686 | 0.689 |
| Woodie | 0.632 | 0.649 | 0.664 | 0.681 | 0.696 | 0.713 | 0.728 |
| Fibonacci | 0.649 | 0.662 | 0.669 | 0.681 | 0.694 | 0.701 | 0.713 |
| Pivot points | S3 | S2 | S1 | PP | R1 | R2 | R3 |
|---|---|---|---|---|---|---|---|
| Standard | 0.563 | 0.609 | 0.641 | 0.687 | 0.719 | 0.765 | 0.797 |
| Camarilla | 0.651 | 0.658 | 0.665 | 0.672 | 0.679 | 0.686 | 0.694 |
| Woodie | 0.555 | 0.606 | 0.633 | 0.684 | 0.711 | 0.762 | 0.789 |
| Fibonacci | 0.609 | 0.639 | 0.658 | 0.687 | 0.717 | 0.736 | 0.765 |
| Pivot points | S3 | S2 | S1 | PP | R1 | R2 | R3 |
|---|---|---|---|---|---|---|---|
| Standard | 0.477 | 0.549 | 0.603 | 0.675 | 0.729 | 0.801 | 0.855 |
| Camarilla | 0.623 | 0.635 | 0.647 | 0.658 | 0.670 | 0.681 | 0.693 |
| Woodie | 0.469 | 0.545 | 0.595 | 0.671 | 0.721 | 0.797 | 0.847 |
| Fibonacci | 0.549 | 0.597 | 0.627 | 0.675 | 0.723 | 0.753 | 0.801 |
Numerical data
The following is the status of the technical indicators and moving averages at the time of publication of this technical analysis:
| RSI (14): | 60.06 | |
| MACD (12,26,9): | 0.0050 | |
| Directional Movement: | 25.714 | |
| AROON (14): | 21.429 | |
| DEMA (21): | 0.684 | |
| Parabolic SAR (0,02-0,02-0,2): | 0.737 | |
| Elder Ray (13): | 0.019 | |
| Super Trend (3,10): | 0.733 | |
| Zig ZAG (10): | 0.714 | |
| VORTEX (21): | 0.9690 | |
| Stochastique (14,3,5): | 45.30 | |
| TEMA (21): | 0.687 | |
| Williams %R (14): | -30.77 | |
| Chande Momentum Oscillator (20): | 0.020 | |
| Repulse (5,40,3): | 3.7290 | |
| ROCnROLL: | 1 | |
| TRIX (15,9): | 0.0640 | |
| Courbe Coppock: | 7.00 |
| MA7: | 0.678 | |
| MA20: | 0.673 | |
| MA50: | 0.669 | |
| MA100: | 0.668 | |
| MAexp7: | 0.685 | |
| MAexp20: | 0.679 | |
| MAexp50: | 0.672 | |
| MAexp100: | 0.665 | |
| Price / MA7: | +5.31% | |
| Price / MA20: | +6.09% | |
| Price / MA50: | +6.73% | |
| Price / MA100: | +6.89% | |
| Price / MAexp7: | +4.23% | |
| Price / MAexp20: | +5.15% | |
| Price / MAexp50: | +6.25% | |
| Price / MAexp100: | +7.37% |
About author
Online


Add a comment
Comments
0 comments on the analysis VOCENTO - Daily