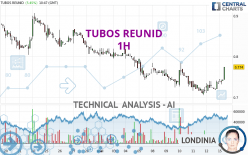
TUBOS REUNID - 1H - Technical analysis published on 05/15/2023 (GMT)
- 104
- 0
Click here for a new analysis!
- Timeframe : 1H
- - Analysis generated on
- Status : LEVEL MAINTAINED

Summary of the analysis

Additional analysis
Quotes
The TUBOS REUNID price is 0.774 EUR. The price registered an increase of +5.45% on the session and was traded between 0.732 EUR and 0.774 EUR over the period. The price is currently at +5.74% from its lowest and 0% from its highest.The Central Gaps scanner detects the formation of a bullish gap marking the strong presence of buyers against sellers at the opening. This formed a quotation gap.
Opening Gap UP
Type : Bullish
Timeframe : Openning
A study of price movements over other periods shows the following variations:
Near a new LOW record (1 month)
Type : Bearish
Timeframe : Weekly
The Central Volumes scanner detects abnormal volumes on the asset:
Abnormal volumes
Timeframe : 50 days
Technical
Technical analysis of this 1H chart of TUBOS REUNID indicates that the overall trend is not clearly defined. The strong bullish signals currently being given by short-term moving averages could allow the overall trend to return to bullish. The Central Indicators scanner detects a bullish signal on moving averages that could impact this trend:
Bullish price crossover with adaptative moving average 20
Type : Bullish
Timeframe : 1 hour
In fact, 15 technical indicators on 18 studied are currently bullish. Caution: the Central Indicators scanner currently detects an excess:
CCI indicator is overbought : over 100
Type : Neutral
Timeframe : 1 hour
CCI indicator: bearish divergence
Type : Bearish
Timeframe : 1 hour
Williams %R indicator is overbought : over -20
Type : Neutral
Timeframe : 1 hour
Pivot points : price is over resistance 1
Type : Neutral
Timeframe : 1 hour
SuperTrend indicator bullish reversal
Type : Bullish
Timeframe : 1 hour
MACD indicator is back over 0
Type : Bullish
Timeframe : 1 hour
Price is back under the pivot point
Type : Bearish
Timeframe : Weekly
Central Patterns, the scanner specializing in chart patterns, did not identify any signals.
No result was found by the Central Candlesticks scanner on Japanese candlesticks.
| S3 | S2 | S1 | Price | R1 | R2 | R3 | |
|---|---|---|---|---|---|---|---|
| ProTrendLines | 0.707 | 0.724 | 0.741 | 0.774 | 0.790 | 0.867 | 0.910 |
| Change (%) | -8.66% | -6.46% | -4.26% | - | +2.07% | +12.02% | +17.57% |
| Change | -0.067 | -0.050 | -0.033 | - | +0.016 | +0.093 | +0.136 |
| Level | Intermediate | Minor | Minor | - | Intermediate | Minor | Major |
Pivot points can also be used to set your price objectives. Here is the price situation in relation to pivot points:
| Pivot points | S3 | S2 | S1 | PP | R1 | R2 | R3 |
|---|---|---|---|---|---|---|---|
| Standard | 0.685 | 0.697 | 0.716 | 0.728 | 0.747 | 0.759 | 0.778 |
| Camarilla | 0.726 | 0.728 | 0.731 | 0.734 | 0.737 | 0.740 | 0.743 |
| Woodie | 0.688 | 0.699 | 0.719 | 0.730 | 0.750 | 0.761 | 0.781 |
| Fibonacci | 0.697 | 0.709 | 0.717 | 0.728 | 0.740 | 0.748 | 0.759 |
| Pivot points | S3 | S2 | S1 | PP | R1 | R2 | R3 |
|---|---|---|---|---|---|---|---|
| Standard | 0.618 | 0.661 | 0.698 | 0.741 | 0.778 | 0.821 | 0.858 |
| Camarilla | 0.712 | 0.719 | 0.727 | 0.734 | 0.741 | 0.749 | 0.756 |
| Woodie | 0.614 | 0.660 | 0.694 | 0.740 | 0.774 | 0.820 | 0.854 |
| Fibonacci | 0.661 | 0.692 | 0.711 | 0.741 | 0.772 | 0.791 | 0.821 |
| Pivot points | S3 | S2 | S1 | PP | R1 | R2 | R3 |
|---|---|---|---|---|---|---|---|
| Standard | 0.566 | 0.670 | 0.738 | 0.842 | 0.910 | 1.014 | 1.082 |
| Camarilla | 0.758 | 0.774 | 0.789 | 0.805 | 0.821 | 0.837 | 0.852 |
| Woodie | 0.547 | 0.661 | 0.719 | 0.833 | 0.891 | 1.005 | 1.063 |
| Fibonacci | 0.670 | 0.736 | 0.777 | 0.842 | 0.908 | 0.949 | 1.014 |
Numerical data
The following are the details of the technical indicators and moving averages that were collected to generate this technical analysis:
| RSI (14): | 56.11 | |
| MACD (12,26,9): | 0.0000 | |
| Directional Movement: | 5.347 | |
| AROON (14): | 100.000 | |
| DEMA (21): | 0.731 | |
| Parabolic SAR (0,02-0,02-0,2): | 0.717 | |
| Elder Ray (13): | 0.010 | |
| Super Trend (3,10): | 0.751 | |
| Zig ZAG (10): | 0.749 | |
| VORTEX (21): | 1.0290 | |
| Stochastique (14,3,5): | 93.16 | |
| TEMA (21): | 0.741 | |
| Williams %R (14): | 0.00 | |
| Chande Momentum Oscillator (20): | 0.029 | |
| Repulse (5,40,3): | 2.3490 | |
| ROCnROLL: | 1 | |
| TRIX (15,9): | -0.0740 | |
| Courbe Coppock: | 5.20 |
| MA7: | 0.740 | |
| MA20: | 0.796 | |
| MA50: | 0.783 | |
| MA100: | 0.544 | |
| MAexp7: | 0.740 | |
| MAexp20: | 0.733 | |
| MAexp50: | 0.744 | |
| MAexp100: | 0.767 | |
| Price / MA7: | +4.59% | |
| Price / MA20: | -2.76% | |
| Price / MA50: | -1.15% | |
| Price / MA100: | +42.28% | |
| Price / MAexp7: | +4.59% | |
| Price / MAexp20: | +5.59% | |
| Price / MAexp50: | +4.03% | |
| Price / MAexp100: | +0.91% |
About author
Online


Add a comment
Comments
0 comments on the analysis TUBOS REUNID - 1H