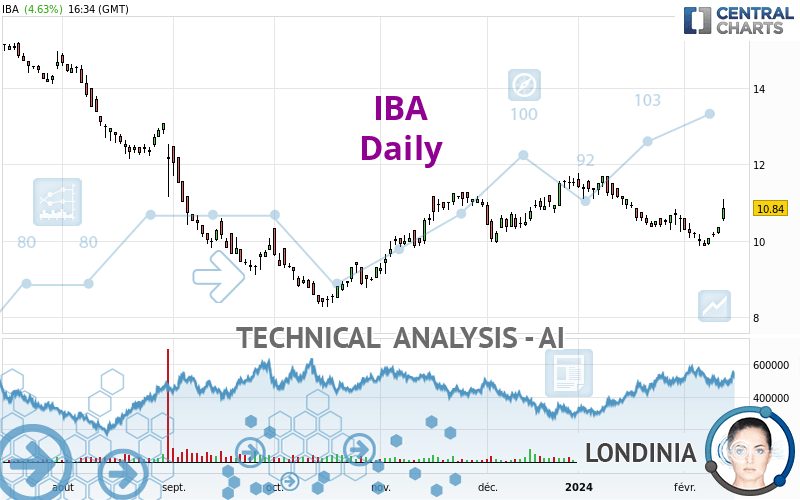
IBA - Daily - Technical analysis published on 02/14/2024 (GMT)
- 90
- 0
Click here for a new analysis!
- Timeframe : Daily
- - Analysis generated on
- Status : INVALID

Summary of the analysis

Additional analysis
Quotes
The IBA price is 10.84 EUR. On the day, this instrument gained +4.63% and was between 10.50 EUR and 11.08 EUR. This implies that the price is at +3.24% from its lowest and at -2.17% from its highest.The Central Gaps scanner detects a bullish gap which is a sign that buyers have taken the lead in the very short term.
Opening Gap UP
Type : Bullish
Timeframe : Openning
A study of price movements over other periods shows the following variations:
Near a new HIGH record (1 month)
Type : Bullish
Timeframe : Weekly
Abnormal volumes on IBA were detected by the Central Volumes scanner:
Abnormal volumes
Timeframe : 5 days
Technical
Technical analysis of IBA in Daily shows an overall slightly bullish trend. Only 53.57% of the signals given by moving averages are bullish. This slightly bullish trend is not supported by the signals currently being given by short-term moving averages. The Central Indicators market scanner is currently detecting several bullish signals that could impact this trend:
Bullish price crossover with Moving Average 20
Type : Bullish
Timeframe : Daily
Bullish price crossover with Moving Average 50
Type : Bullish
Timeframe : Daily
Bullish price crossover with adaptative moving average 50
Type : Bullish
Timeframe : Daily
Bullish price crossover with adaptative moving average 100
Type : Bullish
Timeframe : Daily
The technical indicators are bullish. There is still some doubt about the price increase.
But beware of excesses. The Central Indicators scanner currently detects this:
CCI indicator is overbought : over 100
Type : Neutral
Timeframe : Daily
Williams %R indicator is overbought : over -20
Type : Neutral
Timeframe : Daily
Pivot points : price is over resistance 3
Type : Neutral
Timeframe : Daily
Pivot points : price is over resistance 3
Type : Neutral
Timeframe : Weekly
RSI indicator is back over 50
Type : Bullish
Timeframe : Daily
MACD crosses UP its Moving Average
Type : Bullish
Timeframe : Daily
Parabolic SAR indicator bullish reversal
Type : Bullish
Timeframe : Daily
Aroon indicator bullish trend
Type : Bullish
Timeframe : Daily
SuperTrend indicator bullish reversal
Type : Bullish
Timeframe : Daily
Momentum indicator is back over 0
Type : Bullish
Timeframe : Daily
An analysis of the price chart with the Central Patterns scanner (detector of chart patterns and resistances and supports) shows several results that can have an impact on the price change:
Near resistance of channel
Type : Bearish
Timeframe : Daily
Near resistance of triangle
Type : Bearish
Timeframe : Daily
For a small rebound in the very short term, the Central Candlesticks scanner currently notes the presence of this bullish pattern in Japanese candlesticks:
Upside gap
Type : Bullish
Timeframe : Daily
| S3 | S2 | S1 | Price | R1 | R2 | R3 | |
|---|---|---|---|---|---|---|---|
| ProTrendLines | 8.39 | 9.87 | 10.72 | 10.84 | 11.78 | 13.37 | 14.75 |
| Change (%) | -22.60% | -8.95% | -1.11% | - | +8.67% | +23.34% | +36.07% |
| Change | -2.45 | -0.97 | -0.12 | - | +0.94 | +2.53 | +3.91 |
| Level | Major | Major | Intermediate | - | Major | Intermediate | Intermediate |
Attention could also be paid to pivot points to set price objectives:
| Pivot points | S3 | S2 | S1 | PP | R1 | R2 | R3 |
|---|---|---|---|---|---|---|---|
| Standard | 9.95 | 10.23 | 10.53 | 10.81 | 11.11 | 11.39 | 11.69 |
| Camarilla | 10.68 | 10.73 | 10.79 | 10.84 | 10.89 | 10.95 | 11.00 |
| Woodie | 9.97 | 10.24 | 10.55 | 10.82 | 11.13 | 11.40 | 11.71 |
| Fibonacci | 10.23 | 10.45 | 10.59 | 10.81 | 11.03 | 11.17 | 11.39 |
| Pivot points | S3 | S2 | S1 | PP | R1 | R2 | R3 |
|---|---|---|---|---|---|---|---|
| Standard | 9.57 | 9.71 | 9.93 | 10.07 | 10.29 | 10.43 | 10.65 |
| Camarilla | 10.04 | 10.07 | 10.11 | 10.14 | 10.17 | 10.21 | 10.24 |
| Woodie | 9.60 | 9.73 | 9.96 | 10.09 | 10.32 | 10.45 | 10.68 |
| Fibonacci | 9.71 | 9.85 | 9.94 | 10.07 | 10.21 | 10.30 | 10.43 |
| Pivot points | S3 | S2 | S1 | PP | R1 | R2 | R3 |
|---|---|---|---|---|---|---|---|
| Standard | 8.37 | 9.29 | 9.93 | 10.85 | 11.49 | 12.41 | 13.05 |
| Camarilla | 10.13 | 10.27 | 10.42 | 10.56 | 10.70 | 10.85 | 10.99 |
| Woodie | 8.22 | 9.22 | 9.78 | 10.78 | 11.34 | 12.34 | 12.90 |
| Fibonacci | 9.29 | 9.89 | 10.26 | 10.85 | 11.45 | 11.82 | 12.41 |
Numerical data
The following is the status of the technical indicators and moving averages at the time of publication of this technical analysis:
| RSI (14): | 57.52 | |
| MACD (12,26,9): | -0.1500 | |
| Directional Movement: | 13.29 | |
| AROON (14): | 35.71 | |
| DEMA (21): | 10.25 | |
| Parabolic SAR (0,02-0,02-0,2): | 9.86 | |
| Elder Ray (13): | 0.41 | |
| Super Trend (3,10): | 9.86 | |
| Zig ZAG (10): | 10.84 | |
| VORTEX (21): | 0.8600 | |
| Stochastique (14,3,5): | 53.86 | |
| TEMA (21): | 10.15 | |
| Williams %R (14): | -19.67 | |
| Chande Momentum Oscillator (20): | 0.36 | |
| Repulse (5,40,3): | 3.7500 | |
| ROCnROLL: | 1 | |
| TRIX (15,9): | -0.2700 | |
| Courbe Coppock: | 5.93 |
| MA7: | 10.20 | |
| MA20: | 10.41 | |
| MA50: | 10.75 | |
| MA100: | 10.23 | |
| MAexp7: | 10.36 | |
| MAexp20: | 10.46 | |
| MAexp50: | 10.61 | |
| MAexp100: | 10.92 | |
| Price / MA7: | +6.27% | |
| Price / MA20: | +4.13% | |
| Price / MA50: | +0.84% | |
| Price / MA100: | +5.96% | |
| Price / MAexp7: | +4.63% | |
| Price / MAexp20: | +3.63% | |
| Price / MAexp50: | +2.17% | |
| Price / MAexp100: | -0.73% |
News
Don't forget to follow the news on IBA. At the time of publication of this analysis, the latest news was as follows:
- PanTera signs agreement with Bayer for the supply of actinium-225
- IBA acquires Radcal Corporation to expand Medical Imaging Quality Assurance offering and strengthen US presence
- IBA – TRANSPARENCY NOTIFICATION
- IBA - Regulated Information
- IBA – Transparency Notification
About author
Online


Add a comment
Comments
0 comments on the analysis IBA - Daily