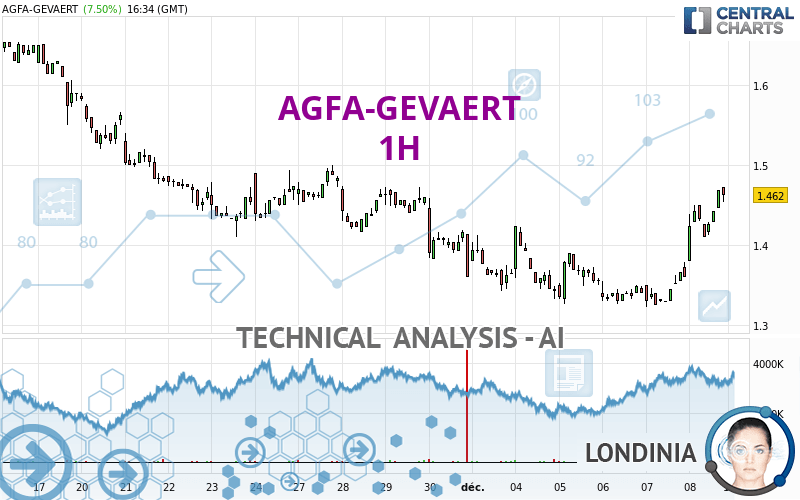
AGFA-GEVAERT - 1H - Technical analysis published on 12/11/2023 (GMT)
- 100
- 0
Click here for a new analysis!
- Timeframe : 1H
- - Analysis generated on
- Status : INVALID

Summary of the analysis

Additional analysis
Quotes
The AGFA-GEVAERT price is 1.462 EUR. The price registered an increase of +7.50% on the session with the lowest point at 1.380 EUR and the highest point at 1.472 EUR. The deviation from the price is +5.94% for the low point and -0.68% for the high point.A bullish gap was detected at the opening by the Central Gaps scanner. There are a lot of buyers and they have the upper hand in the very short term.
Opening Gap UP
Type : Bullish
Timeframe : Openning
A study of price movements over other periods shows the following variations:
New LOW record (5 years)
Type : Bearish
Timeframe : Weekly
Near a new LOW record (1 year)
Type : Bearish
Timeframe : Weekly
Near a new LOW record (1st january)
Type : Bearish
Timeframe : Weekly
Near a new LOW record (1 month)
Type : Bearish
Timeframe : Weekly
Abnormal volumes on AGFA-GEVAERT were detected by the Central Volumes scanner:
Abnormal volumes
Timeframe : 20 days
Abnormal volumes
Timeframe : 50 days
Technical
A technical analysis in 1H of this AGFA-GEVAERT chart shows a bullish trend. 78.57% of the signals given by moving averages are bullish. The overall trend is reinforced by the strong bullish signals from short-term moving averages. The Central Indicators market scanner currently does not detect any result that concerns moving averages.
An assessment of technical indicators shows a strong bullish signal.
But beware of excesses. The Central Indicators scanner currently detects this:
CCI indicator is overbought : over 100
Type : Neutral
Timeframe : 1 hour
CCI indicator: bearish divergence
Type : Bearish
Timeframe : 1 hour
RSI indicator: bearish divergence
Type : Bearish
Timeframe : 1 hour
Williams %R indicator is overbought : over -20
Type : Neutral
Timeframe : 1 hour
Pivot points : price is over resistance 1
Type : Neutral
Timeframe : Weekly
Pivot points : price is over resistance 3
Type : Neutral
Timeframe : 1 hour
Central Patterns, the market scanner focusing on chart patterns, resistances and supports found these results:
Near horizontal resistance
Type : Bearish
Timeframe : 1 hour
Resistance of channel is broken
Type : Bullish
Timeframe : 1 hour
The Central Candlesticks scanner which studies Japanese candlesticks did not detect anything.
| S3 | S2 | S1 | Price | R1 | R2 | R3 | |
|---|---|---|---|---|---|---|---|
| ProTrendLines | 1.324 | 1.410 | 1.446 | 1.462 | 1.497 | 1.611 | 1.730 |
| Change (%) | -9.44% | -3.56% | -1.09% | - | +2.39% | +10.19% | +18.33% |
| Change | -0.138 | -0.052 | -0.016 | - | +0.035 | +0.149 | +0.268 |
| Level | Intermediate | Minor | Major | - | Major | Minor | Major |
To determine price objectives, it is also possible to use the pivot points. Here is the price position in relation to pivot points:
| Pivot points | S3 | S2 | S1 | PP | R1 | R2 | R3 |
|---|---|---|---|---|---|---|---|
| Standard | 1.312 | 1.346 | 1.404 | 1.438 | 1.496 | 1.530 | 1.588 |
| Camarilla | 1.437 | 1.445 | 1.454 | 1.462 | 1.470 | 1.479 | 1.487 |
| Woodie | 1.324 | 1.352 | 1.416 | 1.444 | 1.508 | 1.536 | 1.600 |
| Fibonacci | 1.346 | 1.381 | 1.403 | 1.438 | 1.473 | 1.495 | 1.530 |
| Pivot points | S3 | S2 | S1 | PP | R1 | R2 | R3 |
|---|---|---|---|---|---|---|---|
| Standard | 1.146 | 1.244 | 1.304 | 1.402 | 1.462 | 1.560 | 1.620 |
| Camarilla | 1.321 | 1.335 | 1.350 | 1.364 | 1.379 | 1.393 | 1.408 |
| Woodie | 1.127 | 1.235 | 1.285 | 1.393 | 1.443 | 1.551 | 1.601 |
| Fibonacci | 1.244 | 1.304 | 1.342 | 1.402 | 1.462 | 1.500 | 1.560 |
| Pivot points | S3 | S2 | S1 | PP | R1 | R2 | R3 |
|---|---|---|---|---|---|---|---|
| Standard | 0.813 | 1.087 | 1.223 | 1.497 | 1.633 | 1.907 | 2.043 |
| Camarilla | 1.247 | 1.285 | 1.322 | 1.360 | 1.398 | 1.435 | 1.473 |
| Woodie | 0.745 | 1.053 | 1.155 | 1.463 | 1.565 | 1.873 | 1.975 |
| Fibonacci | 1.087 | 1.243 | 1.340 | 1.497 | 1.653 | 1.750 | 1.907 |
Numerical data
The following are the details of the technical indicators and moving averages that were collected to generate this technical analysis:
| RSI (14): | 68.73 | |
| MACD (12,26,9): | 0.0260 | |
| Directional Movement: | 27.503 | |
| AROON (14): | 100.000 | |
| DEMA (21): | 1.427 | |
| Parabolic SAR (0,02-0,02-0,2): | 1.393 | |
| Elder Ray (13): | 0.048 | |
| Super Trend (3,10): | 1.400 | |
| Zig ZAG (10): | 1.462 | |
| VORTEX (21): | 1.1750 | |
| Stochastique (14,3,5): | 95.57 | |
| TEMA (21): | 1.454 | |
| Williams %R (14): | -6.94 | |
| Chande Momentum Oscillator (20): | 0.134 | |
| Repulse (5,40,3): | 1.4140 | |
| ROCnROLL: | 1 | |
| TRIX (15,9): | 0.1500 | |
| Courbe Coppock: | 15.45 |
| MA7: | 1.369 | |
| MA20: | 1.479 | |
| MA50: | 1.545 | |
| MA100: | 1.852 | |
| MAexp7: | 1.437 | |
| MAexp20: | 1.399 | |
| MAexp50: | 1.386 | |
| MAexp100: | 1.409 | |
| Price / MA7: | +6.79% | |
| Price / MA20: | -1.15% | |
| Price / MA50: | -5.37% | |
| Price / MA100: | -21.06% | |
| Price / MAexp7: | +1.74% | |
| Price / MAexp20: | +4.50% | |
| Price / MAexp50: | +5.48% | |
| Price / MAexp100: | +3.76% |
News
Don't forget to follow the news on AGFA-GEVAERT. At the time of publication of this analysis, the latest news was as follows:
- At RSNA 2023, AGFA HealthCare Presents the Application of Generative AI in Radiology, as Well as New RUBEE(R) AI Specialty Packages
- The Agfa-Gevaert Group in Q3 2023: overall EBITDA growth driven by strong performance of the growth engines, while film business under pressure
- Empowering Imaging Without Barriers: At RSNA 2023, AGFA HealthCare Showcases the Power of Enterprise Imaging Innovations and the Imaging Health Network (TM)
- The Agfa-Gevaert Group in Q2 2023: continued progress for the growth engines
- AGFA HealthCare Joins the AWS Partner Network
About author
Online


Add a comment
Comments
0 comments on the analysis AGFA-GEVAERT - 1H