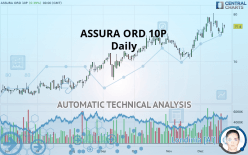
ASSURA ORD 10P - Daily - Technical analysis published on 12/26/2019 (GMT)
- Who voted?
- 260
- 0
Click here for a new analysis!
- Timeframe : Daily
- - Analysis generated on
- Status : LEVEL MAINTAINED
Summary of the analysis

Additional analysis
Quotes
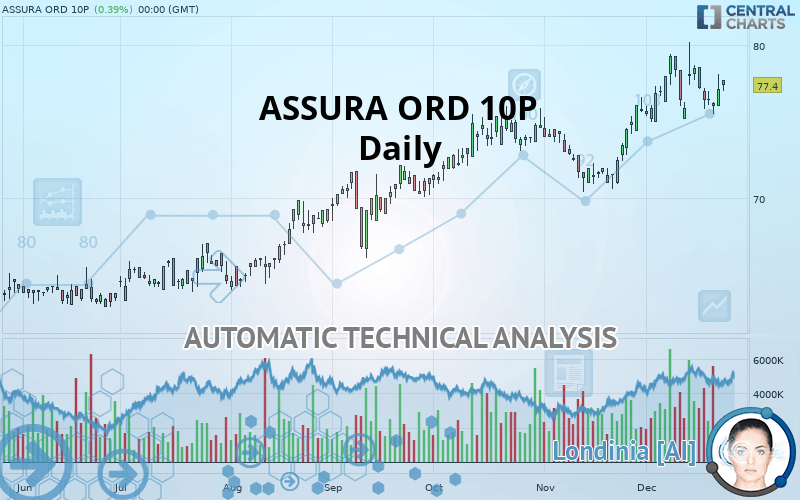
ASSURA ORD 10P rating 77.4 GBX. On the day, this instrument gained +0.39% and was between 77.0 GBX and 77.7 GBX. This implies that the price is at +0.52% from its lowest and at -0.39% from its highest.So that you have an overall view of the price change, here is a table showing the variations over several periods:
Near a new HIGH record (5 years)
Type : Bullish
Timeframe : Weekly
Near a new HIGH record (1 year)
Type : Bullish
Timeframe : Weekly
Near a new HIGH record (1st january)
Type : Bullish
Timeframe : Weekly
Technical
Technical analysis of this Daily chart of ASSURA ORD 10P indicates that the overall trend is strongly bullish. The signals given by the moving averages are 92.86% bullish. This strong bullish trend is confirmed by the strong signals currently being given by short-term moving averages. An assessment of moving averages reveals a bearish signal that could impact this trend:
Bearish price crossover with Moving Average 20
Type : Bearish
Timeframe : Daily
On the 18 technical indicators analysed, 6 are bullish, 9 are neutral and 3 are bearish. Caution: the Central Indicators scanner currently detects an excess:
Williams %R indicator is oversold : under -80
Type : Neutral
Timeframe : Daily
Williams %R indicator is overbought : over -20
Type : Neutral
Timeframe : Daily
Pivot points : price is over resistance 2
Type : Neutral
Timeframe : Daily
Parabolic SAR indicator bearish reversal
Type : Bearish
Timeframe : Daily
Momentum indicator is back under 0
Type : Bearish
Timeframe : Daily
Central Patterns, the market scanner focusing on chart patterns, resistances and supports found this result:
Near support of channel
Type : Bullish
Timeframe : Daily
The Central Candlesticks scanner which studies Japanese candlesticks did not detect anything.
| S3 | S2 | S1 | Price | R1 | R2 | R3 | |
|---|---|---|---|---|---|---|---|
| ProTrendLines | 66.9 | 71.0 | 75.4 | 77.4 | 79.3 | 140.8 | 175.0 |
| Change (%) | -13.57% | -8.27% | -2.58% | - | +2.45% | +81.91% | +126.10% |
| Change | -10.5 | -6.4 | -2.0 | - | +1.9 | +63.4 | +97.6 |
| Level | Intermediate | Intermediate | Major | - | Major | Minor | Minor |
To determine price objectives, it is also possible to use the pivot points. Here is the price position in relation to pivot points:
| Pivot points | S3 | S2 | S1 | PP | R1 | R2 | R3 |
|---|---|---|---|---|---|---|---|
| Standard | 74.8 | 75.1 | 75.6 | 75.9 | 76.4 | 76.7 | 77.2 |
| Camarilla | 75.8 | 75.9 | 75.9 | 76.0 | 76.1 | 76.2 | 76.2 |
| Woodie | 74.8 | 75.2 | 75.6 | 76.0 | 76.4 | 76.8 | 77.2 |
| Fibonacci | 75.1 | 75.4 | 75.6 | 75.9 | 76.2 | 76.4 | 76.7 |
| Pivot points | S3 | S2 | S1 | PP | R1 | R2 | R3 |
|---|---|---|---|---|---|---|---|
| Standard | 70.4 | 72.8 | 75.4 | 77.8 | 80.4 | 82.8 | 85.4 |
| Camarilla | 76.6 | 77.1 | 77.5 | 78.0 | 78.5 | 78.9 | 79.4 |
| Woodie | 70.5 | 72.9 | 75.5 | 77.9 | 80.5 | 82.9 | 85.5 |
| Fibonacci | 72.8 | 74.7 | 75.9 | 77.8 | 79.7 | 80.9 | 82.8 |
| Pivot points | S3 | S2 | S1 | PP | R1 | R2 | R3 |
|---|---|---|---|---|---|---|---|
| Standard | 65.7 | 68.1 | 71.9 | 74.3 | 78.1 | 80.5 | 84.3 |
| Camarilla | 74.1 | 74.7 | 75.2 | 75.8 | 76.4 | 76.9 | 77.5 |
| Woodie | 66.5 | 68.5 | 72.7 | 74.7 | 78.9 | 80.9 | 85.1 |
| Fibonacci | 68.1 | 70.4 | 71.9 | 74.3 | 76.6 | 78.1 | 80.5 |
Numerical data
The following is the status of the technical indicators and moving averages at the time of publication of this technical analysis:
| RSI (14): | 55.80 | |
| MACD (12,26,9): | 0.8000 | |
| Directional Movement: | 14.1 | |
| AROON (14): | 50.0 | |
| DEMA (21): | 77.4 | |
| Parabolic SAR (0,02-0,02-0,2): | 80.1 | |
| Elder Ray (13): | 0.4 | |
| Super Trend (3,10): | 74.6 | |
| Zig ZAG (10): | 77.1 | |
| VORTEX (21): | 1.1000 | |
| Stochastique (14,3,5): | 28.80 | |
| TEMA (21): | 77.5 | |
| Williams %R (14): | -59.60 | |
| Chande Momentum Oscillator (20): | 0.1 | |
| Repulse (5,40,3): | 0.2000 | |
| ROCnROLL: | 1 | |
| TRIX (15,9): | 0.2000 | |
| Courbe Coppock: | 3.40 |
| MA7: | 77.1 | |
| MA20: | 76.7 | |
| MA50: | 74.7 | |
| MA100: | 72.2 | |
| MAexp7: | 76.8 | |
| MAexp20: | 76.3 | |
| MAexp50: | 74.7 | |
| MAexp100: | 72.2 | |
| Price / MA7: | +0.39% | |
| Price / MA20: | +0.91% | |
| Price / MA50: | +3.61% | |
| Price / MA100: | +7.20% | |
| Price / MAexp7: | +0.78% | |
| Price / MAexp20: | +1.44% | |
| Price / MAexp50: | +3.61% | |
| Price / MAexp100: | +7.20% |
 Assura
About author

Online


Add a comment
Comments
0 comments on the analysis ASSURA ORD 10P - Daily