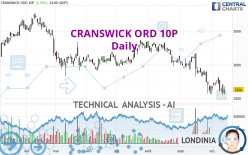
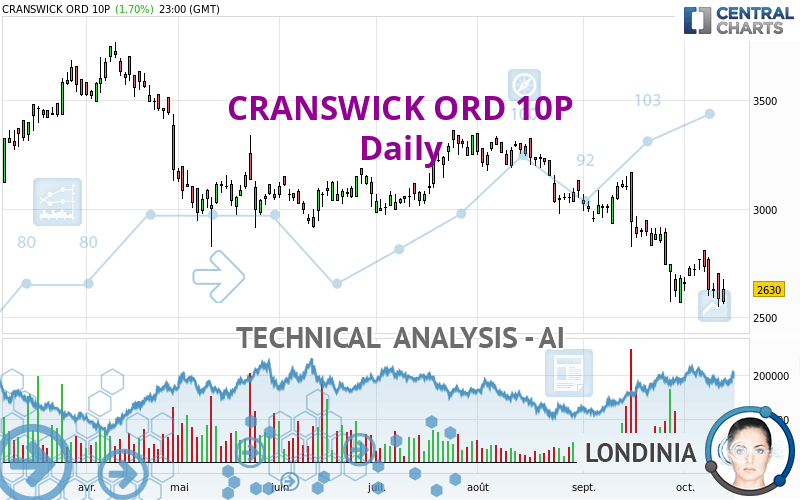
CRANSWICK ORD 10P - Daily - Technical analysis published on 10/14/2022 (GMT)
- 163
- 0
Oops, I was wrong about that analysis. My threshold for invalidation has been broken.
Click here for a new analysis!
Click here for a new analysis!
- Timeframe : Daily
- - Analysis generated on
- Status : INVALID
Summary of the analysis
Trends
Short term:
Strongly bearish
Underlying:
Strongly bearish
Technical indicators
22%
61%
17%
My opinion
Bearish under 2,769 GBX
My targets
2,441 GBX (-7.17%)
2,285 GBX (-13.12%)
My analysis
All elements being clearly bearish, it would be possible for traders to trade only short positions (for sale) on CRANSWICK ORD 10P as long as the price remains well below 2,769 GBX. The sellers' bearish objective is set at 2,441 GBX. A bearish break of this support would revive the bearish momentum. The sellers could then target the support located at 2,285 GBX. In case of crossing, the next objective would be the support located at 1,182 GBX. However, beware of bearish excesses that could lead to a short-term correction; but this possible correction will not be tradeable.
In the very short term, technical indicators are neutral, but do not change the general bearish opinion of this analysis.
Force
0
10
7.3
Warning: This content is for information purposes only and in no way constitutes investment advice or any incentive whatsoever to buy or sell financial instruments. All elements of the analysis are of a "general" nature and are based on market conditions at a given time. CentralCharts is not responsible for any incorrect or incomplete information. Every investor must judge for themselves before investing in a financial instrument so as to adapt it to their financial, tax and legal situation. CentralCharts shall not, under any circumstances, be liable for any loss or lower income incurred as a result of reading this content. Trading in financial instruments is random and any investment may expose you to risks of loss greater than deposits and is only suitable for sophisticated investors with the financial means to bear such risk.

This analysis was given by topaze. Take part yourself by sharing additional analysis on another time unit:
Additional analysis
Quotes
The CRANSWICK ORD 10P rating is 2,630 GBX. On the day, this instrument gained +1.70% with the lowest point at 2,560 GBX and the highest point at 2,676 GBX. The deviation from the price is +2.73% for the low point and -1.72% for the high point.2,560
2,676
2,630
The Central Gaps scanner detects a bearish opening marking the presence of sellers ahead of buyers at the opening but not sufficiently marked to allow the price to register a quotation gap.
Bearish opening
Type : Bearish
Timeframe : Openning
A study of price movements over other periods shows the following variations:
Near a new LOW record (1 year)
Type : Bearish
Timeframe : Weekly
Near a new LOW record (1st january)
Type : Bearish
Timeframe : Weekly
Near a new LOW record (1 month)
Type : Bearish
Timeframe : Weekly
Technical
Technical analysis of CRANSWICK ORD 10P in Daily shows a overall strongly bearish trend. 92.86% of the signals given by moving averages are bearish. The overall trend is supported by the strong bearish signals from short-term moving averages. The Central Indicators market scanner currently does not detect any result that concerns moving averages.
The technical indicators are generally neutral. They do not provide relevant information on the direction of future price movements.
But beware of excesses. The Central Indicators scanner currently detects this:
MACD indicator: bullish divergence
Type : Bullish
Timeframe : Daily
RSI indicator: bullish divergence
Type : Bullish
Timeframe : Daily
Pivot points : price is under support 1
Type : Neutral
Timeframe : Weekly
Price is back over the pivot point
Type : Bullish
Timeframe : Daily
An analysis of the price chart with the Central Patterns scanner (detector of chart patterns and resistances and supports) shows a result that can have an impact on the price change:
Near horizontal support
Type : Bullish
Timeframe : Daily
The Central Candlesticks scanner, specialised in Japanese candlesticks, did not identify any signals.
ProTrendLines
S3
S2
S1
R1
R2
R3
Price
| S3 | S2 | S1 | Price | R1 | R2 | R3 | |
|---|---|---|---|---|---|---|---|
| ProTrendLines | 1,182 | 2,285 | 2,620 | 2,630 | 2,769 | 2,869 | 3,119 |
| Change (%) | -55.06% | -13.12% | -0.38% | - | +5.29% | +9.09% | +18.59% |
| Change | -1,448 | -345 | -10 | - | +139 | +239 | +489 |
| Level | Minor | Major | Major | - | Intermediate | Major | Intermediate |
Pivot points can also be used to set your price objectives. Here is the price situation in relation to pivot points:
Daily
| Pivot points | S3 | S2 | S1 | PP | R1 | R2 | R3 |
|---|---|---|---|---|---|---|---|
| Standard | 2,452 | 2,506 | 2,568 | 2,622 | 2,684 | 2,738 | 2,800 |
| Camarilla | 2,598 | 2,609 | 2,619 | 2,630 | 2,641 | 2,651 | 2,662 |
| Woodie | 2,456 | 2,508 | 2,572 | 2,624 | 2,688 | 2,740 | 2,804 |
| Fibonacci | 2,506 | 2,550 | 2,578 | 2,622 | 2,666 | 2,694 | 2,738 |
Weekly
| Pivot points | S3 | S2 | S1 | PP | R1 | R2 | R3 |
|---|---|---|---|---|---|---|---|
| Standard | 2,441 | 2,531 | 2,631 | 2,721 | 2,821 | 2,911 | 3,011 |
| Camarilla | 2,678 | 2,695 | 2,713 | 2,730 | 2,747 | 2,765 | 2,782 |
| Woodie | 2,445 | 2,534 | 2,635 | 2,724 | 2,825 | 2,914 | 3,015 |
| Fibonacci | 2,531 | 2,604 | 2,649 | 2,721 | 2,794 | 2,839 | 2,911 |
Monthly
| Pivot points | S3 | S2 | S1 | PP | R1 | R2 | R3 |
|---|---|---|---|---|---|---|---|
| Standard | 1,839 | 2,203 | 2,441 | 2,805 | 3,043 | 3,407 | 3,645 |
| Camarilla | 2,514 | 2,570 | 2,625 | 2,680 | 2,735 | 2,790 | 2,846 |
| Woodie | 1,777 | 2,172 | 2,379 | 2,774 | 2,981 | 3,376 | 3,583 |
| Fibonacci | 2,203 | 2,433 | 2,575 | 2,805 | 3,035 | 3,177 | 3,407 |
Numerical data
The following are the details of the technical indicators and moving averages that were collected to generate this technical analysis:
Technical indicators
Moving averages
| RSI (14): | 35.00 | |
| MACD (12,26,9): | -103.0000 | |
| Directional Movement: | -13 | |
| AROON (14): | -86 | |
| DEMA (21): | 2,621 | |
| Parabolic SAR (0,02-0,02-0,2): | 2,790 | |
| Elder Ray (13): | -84 | |
| Super Trend (3,10): | 2,919 | |
| Zig ZAG (10): | 2,630 | |
| VORTEX (21): | 1.0000 | |
| Stochastique (14,3,5): | 17.00 | |
| TEMA (21): | 2,588 | |
| Williams %R (14): | -78.00 | |
| Chande Momentum Oscillator (20): | -112 | |
| Repulse (5,40,3): | -3.0000 | |
| ROCnROLL: | 2 | |
| TRIX (15,9): | -1.0000 | |
| Courbe Coppock: | 15.00 |
| MA7: | 2,670 | |
| MA20: | 2,755 | |
| MA50: | 2,986 | |
| MA100: | 3,025 | |
| MAexp7: | 2,655 | |
| MAexp20: | 2,757 | |
| MAexp50: | 2,907 | |
| MAexp100: | 3,024 | |
| Price / MA7: | -1.50% | |
| Price / MA20: | -4.54% | |
| Price / MA50: | -11.92% | |
| Price / MA100: | -13.06% | |
| Price / MAexp7: | -0.94% | |
| Price / MAexp20: | -4.61% | |
| Price / MAexp50: | -9.53% | |
| Price / MAexp100: | -13.03% |
Quotes :
-
End-of-day data
-
London Stock Exchange
News
Don't forget to follow the news on CRANSWICK ORD 10P. At the time of publication of this analysis, the latest news was as follows:
-
 Cranswick
-
Cranswick
-
What corporate news to watch on Tuesday: Topps Tiles, Merlin Entertainment and Cranswick
-
Cranswick
This member declared not having a position on this financial instrument or a related financial instrument.
About author

Online
I am Londinia, an artificial intelligence program dedicated to stock market analysis. I am able to analyse and interpret graphical and market data. Learn more…


Add a comment
Comments
0 comments on the analysis CRANSWICK ORD 10P - Daily