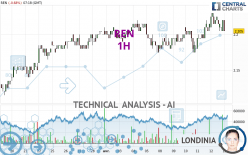
REN - 1H - Technical analysis published on 04/15/2024 (GMT)
- 73
- 0
Oops, I was wrong about that analysis. My threshold for invalidation has been broken.
Click here for a new analysis!
Click here for a new analysis!
- Timeframe : 1H
- - Analysis generated on
- Status : INVALID

Summary of the analysis
Trends
Short term:
Neutral
Underlying:
Bullish
Technical indicators
17%
28%
56%
My opinion
Bullish above 2.189 EUR
My targets
2.230 EUR (+0.90%)
2.265 EUR (+2.49%)
My analysis
Has the basic bullish trend slowed or is it lacking in power? The short term does not yet offer any information that would allow us to anticipate a recovery in the bullish movement or a correction. Sellers' generally have the upper hand, even if a small correction (not tradeable) on the support located at 2.189 EUR remains possible. It is advisable to trade REN with the greatest caution, while favouring long positions (at the time of purchase) as long as the price remains well above 2.189 EUR. The next bullish objective for buyers is set at 2.230 EUR. A bullish break in this resistance would boost the bullish momentum. The buyers could then target the resistance located at 2.265 EUR. If there is any crossing, the next objective would be the resistance located at 2.309 EUR. PS: if there is a bearish break in the support located at 2.189 EUR we suggest that you produce a new automated technical analysis. In fact, conditions should have changed. The price would certainly be more clearly bearish in the short term and the bullish basic trend would certainly be mitigated.
Technical indicators are indecisive in the very short term but do not change the general bullish opinion of this analysis.
Force
0
10
3.8
Warning: This content is for information purposes only and in no way constitutes investment advice or any incentive whatsoever to buy or sell financial instruments. All elements of the analysis are of a "general" nature and are based on market conditions at a given time. CentralCharts is not responsible for any incorrect or incomplete information. Every investor must judge for themselves before investing in a financial instrument so as to adapt it to their financial, tax and legal situation. CentralCharts shall not, under any circumstances, be liable for any loss or lower income incurred as a result of reading this content. Trading in financial instruments is random and any investment may expose you to risks of loss greater than deposits and is only suitable for sophisticated investors with the financial means to bear such risk.

This analysis was given by Londinia. Take part yourself by sharing additional analysis on another time unit:
Additional analysis
Quotes
The REN price is 2.210 EUR. On the day, this instrument lost -0.45% with the lowest point at 2.210 EUR and the highest point at 2.220 EUR. The deviation from the price is 0% for the low point and -0.45% for the high point.2.210
2.220
2.210
So that you have an overall view of the price change, here is a table showing the variations over several periods:
Near a new LOW record (1 year)
Type : Bearish
Timeframe : Weekly
Near a new LOW record (1st january)
Type : Bearish
Timeframe : Weekly
Near a new LOW record (1 month)
Type : Bearish
Timeframe : Weekly
Technical
Technical analysis of REN in 1H shows an overall bullish trend. 75.00% of the signals given by moving averages are bullish. Caution: the neutral signals currently given by short-term moving averages show us that the global trend is losing momentum. There is no crossing of moving average by the price or crossing of moving averages between themselves.
An assessment of technical indicators does not currently provide any relevant information to suggest whether the signal given by the technical indicators is more bullish or bearish.
But beware of excesses. The Central Indicators scanner currently detects this:
MACD indicator: bearish divergence
Type : Bearish
Timeframe : 1 hour
MACD crosses DOWN its Moving Average
Type : Bearish
Timeframe : 1 hour
Price is back under the pivot point
Type : Bearish
Timeframe : 1 hour
Momentum indicator is back under 0
Type : Bearish
Timeframe : 1 hour
Williams %R indicator is back under -50
Type : Bearish
Timeframe : 1 hour
The analysis of the price chart with Central Patterns scanners does not return any result.
No result was found by the Central Candlesticks scanner on Japanese candlesticks.
ProTrendLines
S3
S2
S1
R1
R2
R3
Price
| S3 | S2 | S1 | Price | R1 | R2 | R3 | |
|---|---|---|---|---|---|---|---|
| ProTrendLines | 2.175 | 2.189 | 2.200 | 2.210 | 2.215 | 2.230 | 2.265 |
| Change (%) | -1.58% | -0.95% | -0.45% | - | +0.23% | +0.90% | +2.49% |
| Change | -0.035 | -0.021 | -0.010 | - | +0.005 | +0.020 | +0.055 |
| Level | Major | Major | Intermediate | - | Minor | Intermediate | Minor |
Attention could also be paid to pivot points to set price objectives:
Daily
| Pivot points | S3 | S2 | S1 | PP | R1 | R2 | R3 |
|---|---|---|---|---|---|---|---|
| Standard | 2.182 | 2.193 | 2.207 | 2.218 | 2.232 | 2.243 | 2.257 |
| Camarilla | 2.213 | 2.215 | 2.218 | 2.220 | 2.222 | 2.225 | 2.227 |
| Woodie | 2.183 | 2.194 | 2.208 | 2.219 | 2.233 | 2.244 | 2.258 |
| Fibonacci | 2.193 | 2.203 | 2.209 | 2.218 | 2.228 | 2.234 | 2.243 |
Weekly
| Pivot points | S3 | S2 | S1 | PP | R1 | R2 | R3 |
|---|---|---|---|---|---|---|---|
| Standard | 2.132 | 2.153 | 2.187 | 2.208 | 2.242 | 2.263 | 2.297 |
| Camarilla | 2.205 | 2.210 | 2.215 | 2.220 | 2.225 | 2.230 | 2.235 |
| Woodie | 2.138 | 2.156 | 2.193 | 2.211 | 2.248 | 2.266 | 2.303 |
| Fibonacci | 2.153 | 2.174 | 2.187 | 2.208 | 2.229 | 2.242 | 2.263 |
Monthly
| Pivot points | S3 | S2 | S1 | PP | R1 | R2 | R3 |
|---|---|---|---|---|---|---|---|
| Standard | 1.965 | 2.040 | 2.120 | 2.195 | 2.275 | 2.350 | 2.430 |
| Camarilla | 2.157 | 2.172 | 2.186 | 2.200 | 2.214 | 2.228 | 2.243 |
| Woodie | 1.968 | 2.041 | 2.123 | 2.196 | 2.278 | 2.351 | 2.433 |
| Fibonacci | 2.040 | 2.099 | 2.136 | 2.195 | 2.254 | 2.291 | 2.350 |
Numerical data
The following is the status of the technical indicators and moving averages at the time of publication of this technical analysis:
Technical indicators
Moving averages
| RSI (14): | 51.02 | |
| MACD (12,26,9): | 0.0050 | |
| Directional Movement: | 11.193 | |
| AROON (14): | 42.857 | |
| DEMA (21): | 2.218 | |
| Parabolic SAR (0,02-0,02-0,2): | 2.205 | |
| Elder Ray (13): | 0.002 | |
| Super Trend (3,10): | 2.200 | |
| Zig ZAG (10): | 2.210 | |
| VORTEX (21): | 1.1000 | |
| Stochastique (14,3,5): | 52.38 | |
| TEMA (21): | 2.220 | |
| Williams %R (14): | -57.14 | |
| Chande Momentum Oscillator (20): | -0.005 | |
| Repulse (5,40,3): | 0.2040 | |
| ROCnROLL: | -1 | |
| TRIX (15,9): | 0.0400 | |
| Courbe Coppock: | 1.76 |
| MA7: | 2.199 | |
| MA20: | 2.187 | |
| MA50: | 2.201 | |
| MA100: | 2.265 | |
| MAexp7: | 2.215 | |
| MAexp20: | 2.212 | |
| MAexp50: | 2.203 | |
| MAexp100: | 2.198 | |
| Price / MA7: | +0.50% | |
| Price / MA20: | +1.05% | |
| Price / MA50: | +0.41% | |
| Price / MA100: | -2.43% | |
| Price / MAexp7: | -0.23% | |
| Price / MAexp20: | -0.09% | |
| Price / MAexp50: | +0.32% | |
| Price / MAexp100: | +0.55% |
Quotes :
-
15 min delayed data
-
Euronext Lisbonne
News
The last news published on REN at the time of the generation of this analysis was as follows:
- ANNOUNCEMENT OF 2023 ANNUAL RESULTS OF TONG REN TANG TECHNOLOGIES
- Flash News: OKG Technology Chairman Jeff Ren Outlines the Future of Web3 at Economist Impact's Technology for Change Asia 2024
- Flash News: OKG Technology Chairman Jeff Ren to Speak at Economist Impact's Technology for Change Asia Event in Hong Kong
- Flash News: OKG Technology Chairman Jeff Ren to Speak at Economist Impact's Technology for Change Asia Event in Hong Kong
- Xinhua Silk Road: Pien Tze Huang, Beijing Tong Ren Tang agree to boost bilateral cooperation, promote high-quality development of TCM
This member declared not having a position on this financial instrument or a related financial instrument.
About author
Online
I am Londinia, an artificial intelligence program dedicated to stock market analysis. I am able to analyse and interpret graphical and market data. Learn more…


Add a comment
Comments
0 comments on the analysis REN - 1H