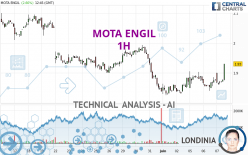
MOTA ENGIL - 1H - Technical analysis published on 06/07/2023 (GMT)
- 98
- 0
Click here for a new analysis!
- Timeframe : 1H
- - Analysis generated on
- Status : TARGET REACHED

Summary of the analysis

Additional analysis
Quotes
MOTA ENGIL rating 1.930 EUR. On the day, this instrument gained +2.66% and was traded between 1.860 EUR and 1.930 EUR over the period. The price is currently at +3.76% from its lowest and 0% from its highest.A bullish gap was detected at the opening by the Central Gaps scanner. There are a lot of buyers and they have the upper hand in the very short term.
Opening Gap UP
Type : Bullish
Timeframe : Openning
A study of price movements over other periods shows the following variations:
Near a new LOW record (1 month)
Type : Bearish
Timeframe : Weekly
Technical
Technical analysis of MOTA ENGIL in 1H shows an overall slightly bullish trend. 57.14% of the signals given by moving averages are bullish. This slightly bullish trend could be reinforced by the strong bullish signals given by short-term moving averages. An assessment of moving averages reveals several bullish signals that could impact this trend:
Bullish price crossover with Moving Average 100
Type : Bullish
Timeframe : 1 hour
Bullish price crossover with adaptative moving average 50
Type : Bullish
Timeframe : 1 hour
Bullish price crossover with adaptative moving average 100
Type : Bullish
Timeframe : 1 hour
In fact, 16 technical indicators on 18 studied are currently positioned bullish. But beware of excesses. The Central Indicators scanner currently detects this:
CCI indicator is overbought : over 100
Type : Neutral
Timeframe : 1 hour
Williams %R indicator is overbought : over -20
Type : Neutral
Timeframe : 1 hour
Pivot points : price is over resistance 2
Type : Neutral
Timeframe : 1 hour
Ichimoku : price is over the cloud
Type : Bullish
Timeframe : 1 hour
MACD indicator is back over 0
Type : Bullish
Timeframe : 1 hour
Price is back over the pivot point
Type : Bullish
Timeframe : Weekly
The analysis of the price chart with Central Patterns scanners does not return any result.
For a small rebound in the very short term, the Central Candlesticks scanner currently notes the presence of these bullish patterns in Japanese candlesticks:
White marubozu
Type : Bullish
Timeframe : 1 hour
Long white line
Type : Bullish
Timeframe : 1 hour
| S3 | S2 | S1 | Price | R1 | R2 | R3 | |
|---|---|---|---|---|---|---|---|
| ProTrendLines | 1.838 | 1.872 | 1.906 | 1.930 | 1.948 | 1.994 | 2.087 |
| Change (%) | -4.77% | -3.01% | -1.24% | - | +0.93% | +3.32% | +8.13% |
| Change | -0.092 | -0.058 | -0.024 | - | +0.018 | +0.064 | +0.157 |
| Level | Intermediate | Minor | Intermediate | - | Major | Intermediate | Major |
Pivot points can also be used to set your price objectives. Here is the price situation in relation to pivot points:
| Pivot points | S3 | S2 | S1 | PP | R1 | R2 | R3 |
|---|---|---|---|---|---|---|---|
| Standard | 1.805 | 1.823 | 1.851 | 1.869 | 1.897 | 1.915 | 1.943 |
| Camarilla | 1.867 | 1.872 | 1.876 | 1.880 | 1.884 | 1.888 | 1.893 |
| Woodie | 1.811 | 1.826 | 1.857 | 1.872 | 1.903 | 1.918 | 1.949 |
| Fibonacci | 1.823 | 1.840 | 1.851 | 1.869 | 1.886 | 1.897 | 1.915 |
| Pivot points | S3 | S2 | S1 | PP | R1 | R2 | R3 |
|---|---|---|---|---|---|---|---|
| Standard | 1.633 | 1.729 | 1.801 | 1.897 | 1.969 | 2.065 | 2.137 |
| Camarilla | 1.826 | 1.841 | 1.857 | 1.872 | 1.887 | 1.903 | 1.918 |
| Woodie | 1.620 | 1.723 | 1.788 | 1.891 | 1.956 | 2.059 | 2.124 |
| Fibonacci | 1.729 | 1.794 | 1.833 | 1.897 | 1.962 | 2.001 | 2.065 |
| Pivot points | S3 | S2 | S1 | PP | R1 | R2 | R3 |
|---|---|---|---|---|---|---|---|
| Standard | 1.501 | 1.665 | 1.752 | 1.916 | 2.003 | 2.167 | 2.254 |
| Camarilla | 1.769 | 1.792 | 1.815 | 1.838 | 1.861 | 1.884 | 1.907 |
| Woodie | 1.462 | 1.646 | 1.713 | 1.897 | 1.964 | 2.148 | 2.215 |
| Fibonacci | 1.665 | 1.761 | 1.821 | 1.916 | 2.012 | 2.072 | 2.167 |
Numerical data
The following is the status of technical indicators and moving averages registered at the time this technical analysis was created:
| RSI (14): | 66.85 | |
| MACD (12,26,9): | 0.0030 | |
| Directional Movement: | 30.215 | |
| AROON (14): | 71.429 | |
| DEMA (21): | 1.877 | |
| Parabolic SAR (0,02-0,02-0,2): | 1.846 | |
| Elder Ray (13): | 0.020 | |
| Super Trend (3,10): | 1.848 | |
| Zig ZAG (10): | 1.918 | |
| VORTEX (21): | 0.9590 | |
| Stochastique (14,3,5): | 72.22 | |
| TEMA (21): | 1.886 | |
| Williams %R (14): | 0.00 | |
| Chande Momentum Oscillator (20): | 0.064 | |
| Repulse (5,40,3): | 3.2070 | |
| ROCnROLL: | 1 | |
| TRIX (15,9): | 0.0020 | |
| Courbe Coppock: | 0.65 |
| MA7: | 1.883 | |
| MA20: | 1.932 | |
| MA50: | 1.810 | |
| MA100: | 1.702 | |
| MAexp7: | 1.883 | |
| MAexp20: | 1.874 | |
| MAexp50: | 1.880 | |
| MAexp100: | 1.896 | |
| Price / MA7: | +2.50% | |
| Price / MA20: | -0.10% | |
| Price / MA50: | +6.63% | |
| Price / MA100: | +13.40% | |
| Price / MAexp7: | +2.50% | |
| Price / MAexp20: | +2.99% | |
| Price / MAexp50: | +2.66% | |
| Price / MAexp100: | +1.79% |
News
The last news published on MOTA ENGIL at the time of the generation of this analysis was as follows:
- Poly Adds People Strategy Expert and HR Professional Kim Mota to Executive Team as Senior Vice President of People Experiences
- Mota Raises $1.7 Million in Private Placement
- Mota Ventures Successful Immune Line Launch Signs Up Over 5,500 New Customers in 12 Days
- Mota Ventures Moves Forward with Its Acquisition of Spanish CBD Company Sativida
- Mota Ventures Launching Immune Support CBD Line; Pure Herbal Immunity Blend Acquiring 1,838 New Customers Within a Week
About author
Online


Add a comment
Comments
0 comments on the analysis MOTA ENGIL - 1H