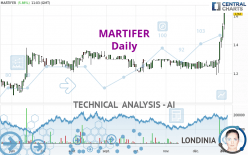
MARTIFER - Daily - Technical analysis published on 01/02/2024 (GMT)
- 108
- 0
Click here for a new analysis!
- Timeframe : Daily
- - Analysis generated on
- Status : TARGET REACHED

Summary of the analysis

Additional analysis
Quotes
The MARTIFER rating is 1.620 EUR. The price has increased by +5.88% since the last closing and was between 1.505 EUR and 1.620 EUR. This implies that the price is at +7.64% from its lowest and at 0% from its highest.The Central Gaps scanner detects a bullish opening. A small advantage for buyers in the very short term.
Bullish opening
Type : Bullish
Timeframe : Openning
A study of price movements over other periods shows the following variations:
Near a new HIGH record (5 years)
Type : Bullish
Timeframe : Weekly
New HIGH record (1 year)
Type : Bullish
Timeframe : Weekly
New HIGH record (1st january)
Type : Bullish
Timeframe : Weekly
New HIGH record (1 month)
Type : Bullish
Timeframe : Weekly
The Central Volumes scanner detects abnormal volumes on the asset:
Abnormal volumes
Timeframe : 5 days
Abnormal volumes
Timeframe : 20 days
Technical
Technical analysis of this Daily chart of MARTIFER indicates that the overall trend is strongly bullish. 89.29% of the signals given by moving averages are bullish. This strongly bullish trend is supported by the strong bullish signals given by short-term moving averages. There is no crossing of moving average by the price or crossing of moving averages between themselves.
Technical indicators are strongly bullish, suggesting that the price increase should continue.
Caution: the Central Indicators scanner currently detects an excess:
RSI indicator is overbought : over 80
Type : Neutral
Timeframe : Daily
CCI indicator is overbought : over 100
Type : Neutral
Timeframe : Daily
Previous candle closed over Bollinger bands
Type : Neutral
Timeframe : Daily
Williams %R indicator is overbought : over -20
Type : Neutral
Timeframe : Daily
Pivot points : price is over resistance 1
Type : Neutral
Timeframe : Daily
Central Patterns, the market scanner focusing on chart patterns, resistances and supports found these results:
Near horizontal resistance
Type : Bearish
Timeframe : Daily
Resistance of channel is broken
Type : Bullish
Timeframe : Daily
The Central Candlesticks scanner which studies Japanese candlesticks did not detect anything.
| S3 | S2 | S1 | Price | R1 | R2 | R3 | |
|---|---|---|---|---|---|---|---|
| ProTrendLines | 1.300 | 1.340 | 1.585 | 1.620 | 4.214 | 5.651 | 8.620 |
| Change (%) | -19.75% | -17.28% | -2.16% | - | +160.12% | +248.83% | +432.10% |
| Change | -0.320 | -0.280 | -0.035 | - | +2.594 | +4.031 | +7.000 |
| Level | Major | Minor | Intermediate | - | Intermediate | Minor | Intermediate |
To determine price objectives, it is also possible to use the pivot points. Here is the price position in relation to pivot points:
| Pivot points | S3 | S2 | S1 | PP | R1 | R2 | R3 |
|---|---|---|---|---|---|---|---|
| Standard | 1.337 | 1.383 | 1.457 | 1.503 | 1.577 | 1.623 | 1.697 |
| Camarilla | 1.497 | 1.508 | 1.519 | 1.530 | 1.541 | 1.552 | 1.563 |
| Woodie | 1.350 | 1.390 | 1.470 | 1.510 | 1.590 | 1.630 | 1.710 |
| Fibonacci | 1.383 | 1.429 | 1.458 | 1.503 | 1.549 | 1.578 | 1.623 |
| Pivot points | S3 | S2 | S1 | PP | R1 | R2 | R3 |
|---|---|---|---|---|---|---|---|
| Standard | 1.070 | 1.170 | 1.350 | 1.450 | 1.630 | 1.730 | 1.910 |
| Camarilla | 1.453 | 1.479 | 1.504 | 1.530 | 1.556 | 1.581 | 1.607 |
| Woodie | 1.110 | 1.190 | 1.390 | 1.470 | 1.670 | 1.750 | 1.950 |
| Fibonacci | 1.170 | 1.277 | 1.343 | 1.450 | 1.557 | 1.623 | 1.730 |
| Pivot points | S3 | S2 | S1 | PP | R1 | R2 | R3 |
|---|---|---|---|---|---|---|---|
| Standard | 0.937 | 1.063 | 1.297 | 1.423 | 1.657 | 1.783 | 2.017 |
| Camarilla | 1.431 | 1.464 | 1.497 | 1.530 | 1.563 | 1.596 | 1.629 |
| Woodie | 0.990 | 1.090 | 1.350 | 1.450 | 1.710 | 1.810 | 2.070 |
| Fibonacci | 1.063 | 1.201 | 1.286 | 1.423 | 1.561 | 1.646 | 1.783 |
Numerical data
The following is the status of the technical indicators and moving averages at the time of publication of this technical analysis:
| RSI (14): | 85.70 | |
| MACD (12,26,9): | 0.0570 | |
| Directional Movement: | 29.433 | |
| AROON (14): | 35.714 | |
| DEMA (21): | 1.413 | |
| Parabolic SAR (0,02-0,02-0,2): | 1.241 | |
| Elder Ray (13): | 0.174 | |
| Super Trend (3,10): | 1.348 | |
| Zig ZAG (10): | 1.620 | |
| VORTEX (21): | 1.1580 | |
| Stochastique (14,3,5): | 97.52 | |
| TEMA (21): | 1.466 | |
| Williams %R (14): | 0.00 | |
| Chande Momentum Oscillator (20): | 0.340 | |
| Repulse (5,40,3): | 20.7600 | |
| ROCnROLL: | 1 | |
| TRIX (15,9): | 0.2110 | |
| Courbe Coppock: | 25.60 |
| MA7: | 1.411 | |
| MA20: | 1.319 | |
| MA50: | 1.299 | |
| MA100: | 1.302 | |
| MAexp7: | 1.451 | |
| MAexp20: | 1.355 | |
| MAexp50: | 1.313 | |
| MAexp100: | 1.293 | |
| Price / MA7: | +14.81% | |
| Price / MA20: | +22.82% | |
| Price / MA50: | +24.71% | |
| Price / MA100: | +24.42% | |
| Price / MAexp7: | +11.65% | |
| Price / MAexp20: | +19.56% | |
| Price / MAexp50: | +23.38% | |
| Price / MAexp100: | +25.29% |
News
Don't forget to follow the news on MARTIFER. At the time of publication of this analysis, the latest news was as follows:
About author
Online


Add a comment
Comments
0 comments on the analysis MARTIFER - Daily