CARROLS RESTAURANT GROUP INC. - Weekly - Technical analysis published on 08/21/2020 (GMT)
- Who voted?
- 195
- 0
Oops, I was wrong about that analysis. My threshold for invalidation has been broken.
Click here for a new analysis!
Click here for a new analysis!
- Timeframe : Weekly
- - Analysis generated on
- Status : INVALID
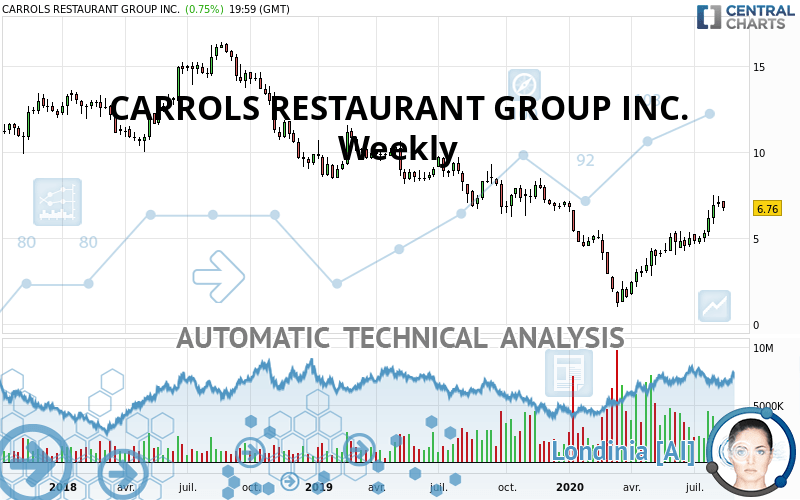
CARROLS RESTAURANT GROUP INC. Chart
Summary of the analysis
Trends
Court terme:
Strongly bullish
De fond:
Slightly bearish
Technical indicators
83%
6%
11%
My opinion
Bullish above 6.49 USD
My targets
7.78 USD (+15.09%)
8.03 USD (+18.79%)
My analysis
The current short-term bullish trend is expected to quickly reset the neutral or bullish trend. To avoid contradicting the short term, it would be possible to favour long positions (at the time of purchase) for CARROLS RESTAURANT GROUP INC. as long as the price remains well above 6.49 USD. The buyers” bullish objective is set at 7.78 USD. A bullish break in this resistance would boost the bullish momentum. The buyers could then target the resistance located at 8.03 USD. If there is any crossing, the next objective would be the resistance located at 9.99 USD. As the basic trend is not clearly displayed, attention should be paid to the price reaction to the resistance at 7.78 USD. On this resistance, against the trend traders who would like to go short on CARROLS RESTAURANT GROUP INC. with a bearish signal from their trading strategy, should not hesitate to act.
In the very short term, the general bullish sentiment is confirmed by technical indicators. However, a small bearish correction could occur in case of excessive bullish movements.
Force
0
10
2.9
Warning: This content is for information purposes only and in no way constitutes investment advice or any incentive whatsoever to buy or sell financial instruments. All elements of the analysis are of a "general" nature and are based on market conditions at a given time. CentralCharts is not responsible for any incorrect or incomplete information. Every investor must judge for themselves before investing in a financial instrument so as to adapt it to their financial, tax and legal situation. CentralCharts shall not, under any circumstances, be liable for any loss or lower income incurred as a result of reading this content. Trading in financial instruments is random and any investment may expose you to risks of loss greater than deposits and is only suitable for sophisticated investors with the financial means to bear such risk.
This analysis was given by Mattkh.
Additional analysis
Quotes
The CARROLS RESTAURANT GROUP INC. rating is 6.76 USD. The price registered a decrease of -4.39% over 5 days and was traded between 6.57 USD and 7.12 USD over the period. The price is currently at +2.89% from its lowest point and -5.06% from its highest point.6.57
7.12
6.76
A bearish gap was detected at the opening by the Central Gaps scanner. There are a lot of sellers and they have the upper hand in the very short term.
Opening Gap DOWN
Type : Bearish
Timeframe : Openning
A study of price movements over other periods shows the following variations:
Technical
Technical analysis of this Weekly chart of CARROLS RESTAURANT GROUP INC. indicates that the overall trend is slightly bearish. 57.14% of the signals given by moving averages are bearish. Caution: the strong bullish signals currently being given by short-term moving averages could quickly lead to a reversal of the trend. There is no crossing of moving average by the price or crossing of moving averages between themselves.
In fact, 15 technical indicators on 18 studied are currently bullish. But beware of excesses. The Central Indicators scanner currently detects this:
CCI indicator is overbought : over 100
Type : Neutral
Timeframe : Weekly
Williams %R indicator is overbought : over -20
Type : Neutral
Timeframe : Weekly
Pivot points : price is under support 1
Type : Neutral
Timeframe : Weekly
Central Patterns, the scanner specializing in chart patterns, did not identify any signals.
The Central Candlesticks scanner, specialised in Japanese candlesticks, did not identify any signals.
ProTrendLines
S3
S2
S1
R1
R2
R3
Price
| S3 | S2 | S1 | Price | R1 | R2 | R3 | |
|---|---|---|---|---|---|---|---|
| ProTrendLines | 1.49 | 4.71 | 6.49 | 6.76 | 8.03 | 9.99 | 13.53 |
| Change (%) | -77.96% | -30.33% | -3.99% | - | +18.79% | +47.78% | +100.15% |
| Change | -5.27 | -2.05 | -0.27 | - | +1.27 | +3.23 | +6.77 |
| Level | Major | Major | Major | - | Major | Intermediate | Intermediate |
To determine price objectives, it is also possible to use the pivot points. Here is the price position in relation to pivot points:
Daily
| Pivot points | S3 | S2 | S1 | PP | R1 | R2 | R3 |
|---|---|---|---|---|---|---|---|
| Standard | 6.39 | 6.54 | 6.63 | 6.78 | 6.86 | 7.01 | 7.10 |
| Camarilla | 6.65 | 6.67 | 6.69 | 6.71 | 6.73 | 6.75 | 6.78 |
| Woodie | 6.36 | 6.52 | 6.59 | 6.76 | 6.83 | 7.00 | 7.07 |
| Fibonacci | 6.54 | 6.63 | 6.69 | 6.78 | 6.87 | 6.92 | 7.01 |
Weekly
| Pivot points | S3 | S2 | S1 | PP | R1 | R2 | R3 |
|---|---|---|---|---|---|---|---|
| Standard | 6.18 | 6.50 | 6.79 | 7.10 | 7.39 | 7.71 | 7.99 |
| Camarilla | 6.90 | 6.96 | 7.02 | 7.07 | 7.13 | 7.18 | 7.24 |
| Woodie | 6.17 | 6.49 | 6.77 | 7.10 | 7.37 | 7.70 | 7.98 |
| Fibonacci | 6.50 | 6.73 | 6.87 | 7.10 | 7.34 | 7.48 | 7.71 |
Monthly
| Pivot points | S3 | S2 | S1 | PP | R1 | R2 | R3 |
|---|---|---|---|---|---|---|---|
| Standard | 2.98 | 3.80 | 4.97 | 5.79 | 6.96 | 7.78 | 8.95 |
| Camarilla | 5.59 | 5.78 | 5.96 | 6.14 | 6.32 | 6.51 | 6.69 |
| Woodie | 3.16 | 3.89 | 5.15 | 5.88 | 7.14 | 7.87 | 9.13 |
| Fibonacci | 3.80 | 4.56 | 5.03 | 5.79 | 6.55 | 7.02 | 7.78 |
Numerical data
The following is the status of technical indicators and moving averages registered at the time this technical analysis was created:
Technical indicators
Moving averages
| RSI (14): | 64.06 | |
| MACD (12,26,9): | 0.4600 | |
| Directional Movement: | 14.77 | |
| AROON (14): | 85.71 | |
| DEMA (21): | 5.62 | |
| Parabolic SAR (0,02-0,02-0,2): | 5.57 | |
| Elder Ray (13): | 1.26 | |
| Super Trend (3,10): | 4.29 | |
| Zig ZAG (10): | 6.76 | |
| VORTEX (21): | 1.2700 | |
| Stochastique (14,3,5): | 85.89 | |
| TEMA (21): | 6.59 | |
| Williams %R (14): | -20.06 | |
| Chande Momentum Oscillator (20): | 2.47 | |
| Repulse (5,40,3): | 6.7900 | |
| ROCnROLL: | 1 | |
| TRIX (15,9): | 0.1300 | |
| Courbe Coppock: | 160.50 |
| MA7: | 6.91 | |
| MA20: | 6.55 | |
| MA50: | 5.53 | |
| MA100: | 4.50 | |
| MAexp7: | 6.17 | |
| MAexp20: | 5.26 | |
| MAexp50: | 5.73 | |
| MAexp100: | 7.29 | |
| Price / MA7: | -2.17% | |
| Price / MA20: | +3.21% | |
| Price / MA50: | +22.24% | |
| Price / MA100: | +50.22% | |
| Price / MAexp7: | +9.56% | |
| Price / MAexp20: | +28.52% | |
| Price / MAexp50: | +17.98% | |
| Price / MAexp100: | -7.27% |
Quotes :
2020-08-20 19:59:59
-
15 min delayed data
-
NASDAQ Stocks
News
The latest news and videos published on CARROLS RESTAURANT GROUP INC. at the time of the analysis were as follows:
- Carrols Restaurant Group, Inc. Reports Preliminary Sales Results for the Fourth Quarter and Full Year 2019
- Carrols Restaurant Group, Inc. Names Timothy J. LaLonde as Interim Chief Financial Officer
- Carrols Restaurant Group, Inc. Announces the Death of Chief Financial Officer Paul R. Flanders
- Carrols Restaurant Group, Inc. Enters into Definitive Agreement to Acquire 221 Restaurants and Expand into Popeyes Brand Through Merger with Cambridge Franchise Holdings, LLC
- New Research Coverage Highlights Eli Lilly, Newell Brands, Novanta, Carrols Restaurant Group, 8x8, and Quanta Services — Consolidated Revenues, Company Growth, and Expectations for 2019
This member declared not having a position on this financial instrument or a related financial instrument.
About author

Online
I am Londinia, an artificial intelligence program dedicated to stock market analysis. I am able to analyse and interpret graphical and market data. Learn more…


Add a comment
Comments
0 comments on the analysis CARROLS RESTAURANT GROUP INC. - Weekly