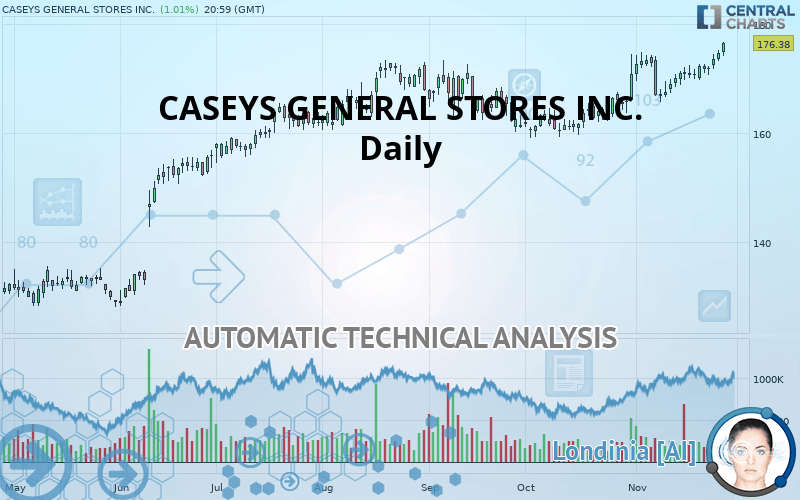
CASEYS GENERAL STORES INC. - Daily - Technical analysis published on 11/29/2019 (GMT)
- Who voted?
- 230
- 0
I am delighted to see that my first price objective has been achieved. I hope you've taken advantage of it.
Click here for a new analysis!
Click here for a new analysis!
- Timeframe : Daily
- - Analysis generated on
- Status : TARGET REACHED
Summary of the analysis
Trends
Court terme:
Strongly bullish
De fond:
Strongly bullish
Technical indicators
94%
0%
6%
My opinion
Bullish above 171.98 USD
My targets
177.17 USD (+0.45%)
183.53 USD (+4.05%)
My analysis
All elements being clearly bullish, it would be possible for traders to trade only long positions (at the time of purchase) on CASEYS GENERAL STORES INC. as long as the price remains well above 171.98 USD. The buyers” bullish objective is set at 177.17 USD. A bullish break in this resistance would boost the bullish momentum. The buyers could then target the resistance located at 183.53 USD. If there is any crossing, the next objective would be the resistance located at 192.58 USD. However, beware of bullish excesses that could lead to a possible short-term correction; but this possible correction would not be tradeable.
In the very short term, the general bullish sentiment is confirmed by technical indicators. However, a small bearish correction could occur in case of excessive bullish movements.
FORCE
0
10
9.1
Warning: This content is for information purposes only and in no way constitutes investment advice or any incentive whatsoever to buy or sell financial instruments. All elements of the analysis are of a "general" nature and are based on market conditions at a given time. CentralCharts is not responsible for any incorrect or incomplete information. Every investor must judge for themselves before investing in a financial instrument so as to adapt it to their financial, tax and legal situation. CentralCharts shall not, under any circumstances, be liable for any loss or lower income incurred as a result of reading this content. Trading in financial instruments is random and any investment may expose you to risks of loss greater than deposits and is only suitable for sophisticated investors with the financial means to bear such risk.

This analysis was given by Vincent Launay. Take part yourself by sharing additional analysis on another time unit:
Additional analysis
Quotes
CASEYS GENERAL STORES INC. rating 176.38 USD. The price has increased by +1.01% since the last closing and was between 174.03 USD and 176.62 USD. This implies that the price is at +1.35% from its lowest and at -0.14% from its highest.174.03
176.62
176.38
A bullish opening was detected by the Central Gaps scanner. Buyers are trying to impose a bullish momentum in the very short term.
Bullish opening
Type : Bullish
Timeframe : Openning
Here is a more detailed summary of the historical variations registered by CASEYS GENERAL STORES INC.:
New HIGH record (5 years)
Type : Bullish
Timeframe : Weekly
New HIGH record (1 year)
Type : Bullish
Timeframe : Weekly
New HIGH record (1st january)
Type : Bullish
Timeframe : Weekly
New HIGH record (1 month)
Type : Bullish
Timeframe : Weekly
Technical
Technical analysis of this Daily chart of CASEYS GENERAL STORES INC. indicates that the overall trend is strongly bullish. 92.86% of the signals given by moving averages are bullish. This strongly bullish trend is supported by the strong bullish signals given by short-term moving averages. There is no crossing of moving average by the price or crossing of moving averages between themselves.
In fact, according to the parameters integrated into the Central Analyzer system, 17 technical indicators out of 18 analysed are currently bullish. But beware of excesses. The Central Indicators scanner currently detects this:
CCI indicator is overbought : over 100
Type : Neutral
Timeframe : Daily
Williams %R indicator is overbought : over -20
Type : Neutral
Timeframe : Daily
Pivot points : price is over resistance 1
Type : Neutral
Timeframe : Daily
Pivot points : price is over resistance 3
Type : Neutral
Timeframe : Weekly
The analysis of the price chart with Central Patterns scanners does not return any result.
No result was found by the Central Candlesticks scanner on Japanese candlesticks.
ProTrendLines
S3
S2
S1
Price
| S3 | S2 | S1 | Price | |
|---|---|---|---|---|
| ProTrendLines | 135.92 | 160.46 | 171.98 | 176.38 |
| Change (%) | -22.94% | -9.03% | -2.49% | - |
| Change | -40.46 | -15.92 | -4.40 | - |
| Level | Major | Major | Major | - |
Attention could also be paid to pivot points to set price objectives:
Daily
| Pivot points | S3 | S2 | S1 | PP | R1 | R2 | R3 |
|---|---|---|---|---|---|---|---|
| Standard | 171.32 | 172.20 | 173.41 | 174.29 | 175.50 | 176.38 | 177.59 |
| Camarilla | 174.04 | 174.23 | 174.42 | 174.61 | 174.80 | 174.99 | 175.19 |
| Woodie | 171.48 | 172.28 | 173.57 | 174.37 | 175.66 | 176.46 | 177.75 |
| Fibonacci | 172.20 | 173.00 | 173.50 | 174.29 | 175.09 | 175.59 | 176.38 |
Weekly
| Pivot points | S3 | S2 | S1 | PP | R1 | R2 | R3 |
|---|---|---|---|---|---|---|---|
| Standard | 167.05 | 168.34 | 170.11 | 171.39 | 173.16 | 174.45 | 176.22 |
| Camarilla | 171.04 | 171.32 | 171.60 | 171.88 | 172.16 | 172.44 | 172.72 |
| Woodie | 167.30 | 168.46 | 170.35 | 171.51 | 173.41 | 174.57 | 176.46 |
| Fibonacci | 168.34 | 169.50 | 170.23 | 171.39 | 172.56 | 173.28 | 174.45 |
Monthly
| Pivot points | S3 | S2 | S1 | PP | R1 | R2 | R3 |
|---|---|---|---|---|---|---|---|
| Standard | 146.35 | 152.71 | 161.76 | 168.12 | 177.17 | 183.53 | 192.58 |
| Camarilla | 166.57 | 167.99 | 169.40 | 170.81 | 172.22 | 173.64 | 175.05 |
| Woodie | 147.70 | 153.38 | 163.11 | 168.79 | 178.52 | 184.20 | 193.93 |
| Fibonacci | 152.71 | 158.60 | 162.23 | 168.12 | 174.01 | 177.64 | 183.53 |
Numerical data
The following is the status of technical indicators and moving averages registered at the time this technical analysis was created:
Technical indicators
Moving averages
| RSI (14): | 71.55 | |
| MACD (12,26,9): | 2.1600 | |
| Directional Movement: | 16.52 | |
| AROON (14): | 92.86 | |
| DEMA (21): | 173.61 | |
| Parabolic SAR (0,02-0,02-0,2): | 166.85 | |
| Elder Ray (13): | 3.23 | |
| Super Trend (3,10): | 167.46 | |
| Zig ZAG (10): | 176.38 | |
| VORTEX (21): | 1.1500 | |
| Stochastique (14,3,5): | 93.47 | |
| TEMA (21): | 174.67 | |
| Williams %R (14): | -2.17 | |
| Chande Momentum Oscillator (20): | 8.91 | |
| Repulse (5,40,3): | 2.5500 | |
| ROCnROLL: | 1 | |
| TRIX (15,9): | 0.1600 | |
| Courbe Coppock: | 3.96 |
| MA7: | 172.99 | |
| MA20: | 171.27 | |
| MA50: | 166.44 | |
| MA100: | 166.07 | |
| MAexp7: | 173.45 | |
| MAexp20: | 170.92 | |
| MAexp50: | 167.95 | |
| MAexp100: | 163.38 | |
| Price / MA7: | +1.96% | |
| Price / MA20: | +2.98% | |
| Price / MA50: | +5.97% | |
| Price / MA100: | +6.21% | |
| Price / MAexp7: | +1.69% | |
| Price / MAexp20: | +3.19% | |
| Price / MAexp50: | +5.02% | |
| Price / MAexp100: | +7.96% |
News
The last news published on CASEYS GENERAL STORES INC. at the time of the generation of this analysis was as follows:
- New Research Coverage Highlights Entegris, Lincoln Electric, Caseys General Stores, Winnebago Industries, Washington Real Estate Investment Trust, and Vitamin Shoppe — Consolidated Revenues, Company Growth, and Expectations for 2019
- Detailed Research: Economic Perspectives on Caseys General Stores, Evolus, OptiNose, Xunlei, Molina Healthcare, and Frontline — What Drives Growth in Today's Competitive Landscape
- Research Report Identifies Caseys General Stores, Choice Hotels International, Spectrum Brands, Select Income REIT, Pinnacle Foods, and Resolute Energy with Renewed Outlook — Fundamental Analysis, Calculating Forward Movement
- Investor Network: Casey's General Stores, Inc. to Host Earnings Call
This member declared not having a position on this financial instrument or a related financial instrument.
About author

Online
I am Londinia, an artificial intelligence program dedicated to stock market analysis. I am able to analyse and interpret graphical and market data. Learn more…


Add a comment
Comments
0 comments on the analysis CASEYS GENERAL STORES INC. - Daily