GVC HOLDINGS ORD EUR0.01 - Daily - Technical analysis published on 01/03/2020 (GMT)
- Who voted?
- 266
- 0
Oops, I was wrong about that analysis. My threshold for invalidation has been broken.
Click here for a new analysis!
Click here for a new analysis!
- Timeframe : Daily
- - Analysis generated on
- Status : INVALID
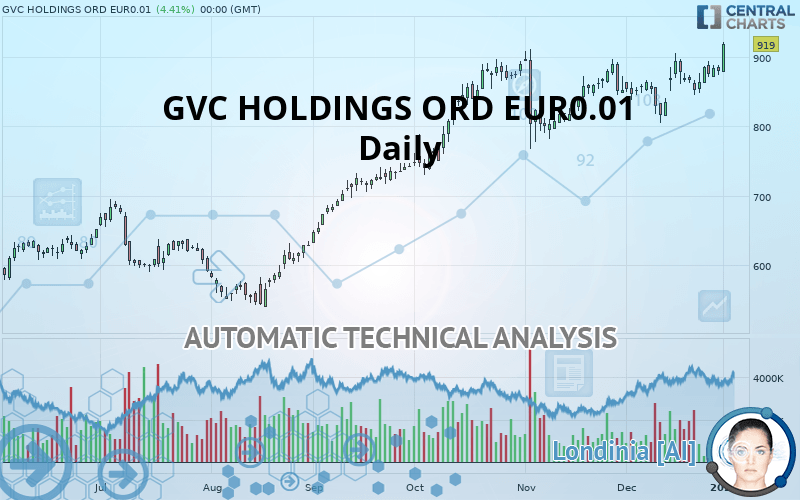
GVC HOLDINGS ORD EUR0.01 Chart
Summary of the analysis
Trends
Court terme:
Strongly bullish
De fond:
Strongly bullish
Technical indicators
72%
6%
22%
My opinion
Bullish above 896.0 GBX
My targets
980.1 GBX (+6.65%)
1,056.0 GBX (+14.91%)
My analysis
GVC HOLDINGS ORD EUR0.01 is part of a very strong bullish trend. Traders may consider trading only long positions (at the time of purchase) as long as the price remains well above 896.0 GBX. The next resistance located at 980.1 GBX is the next bullish objective to be reached. A bullish break in this resistance would boost the bullish momentum. The bullish movement could then continue towards the next resistance located at 1,056.0 GBX. After this resistance, buyers could then target 1,170.0 GBX. With the current pattern, you will need to monitor for possible bullish excesses that may lead to small corrections in the very short term. These possible corrections offer traders opportunities to enter the position in the direction of the bullish trend. Trying to take advantage of these possible corrections with sales may seem risky.
Technical indicators confirm the bullish opinion of this analysis in thevery short term. However, be careful of excessive bullish movements. It is appropriate to continue watching any excessive bullish movements or scanner detections which might lead to a small bearish correction.
FORCE
0
10
8.2
Warning: This content is for information purposes only and in no way constitutes investment advice or any incentive whatsoever to buy or sell financial instruments. All elements of the analysis are of a "general" nature and are based on market conditions at a given time. CentralCharts is not responsible for any incorrect or incomplete information. Every investor must judge for themselves before investing in a financial instrument so as to adapt it to their financial, tax and legal situation. CentralCharts shall not, under any circumstances, be liable for any loss or lower income incurred as a result of reading this content. Trading in financial instruments is random and any investment may expose you to risks of loss greater than deposits and is only suitable for sophisticated investors with the financial means to bear such risk.
This analysis was given by Vincent Launay.
Additional analysis
Quotes
The GVC HOLDINGS ORD EUR0.01 rating is 919.0 GBX. The price registered an increase of +4.41% on the session and was traded between 878.2 GBX and 921.2 GBX over the period. The price is currently at +4.65% from its lowest and -0.24% from its highest.878.2
921.2
919.0
The Central Gaps scanner detects a bullish opening. A small advantage for buyers in the very short term.
Bullish opening
Type : Bullish
Timeframe : Openning
Here is a more detailed summary of the historical variations registered by GVC HOLDINGS ORD EUR0.01:
Near a new HIGH record (1st january)
Type : Bullish
Timeframe : Weekly
Near a new LOW record (1 month)
Type : Bearish
Timeframe : Weekly
Technical
A technical analysis in Daily of this GVC HOLDINGS ORD EUR0.01 chart shows a strongly bullish trend. 92.86% of the signals given by moving averages are bullish. The overall trend is supported by the strong bullish signals from short-term moving averages. There is no crossing of moving average by the price or crossing of moving averages between themselves.
An assessment of technical indicators shows a strong bullish signal.
But beware of excesses. The Central Indicators scanner currently detects this:
CCI indicator is overbought : over 100
Type : Neutral
Timeframe : Daily
CCI indicator: bearish divergence
Type : Bearish
Timeframe : Daily
Williams %R indicator is overbought : over -20
Type : Neutral
Timeframe : Daily
Price is back over the pivot point
Type : Bullish
Timeframe : Daily
Price is back under the pivot point
Type : Bearish
Timeframe : Weekly
The analysis of the price chart with Central Patterns scanners does not return any result.
Central Candlesticks, the scanner specialised in Japanese candlesticks, detects a bullish signal that could support the hypothesis of a small rebound in the very short term:
Piercing line
Type : Bullish
Timeframe : Daily
ProTrendLines
S3
S2
S1
R1
R2
R3
Price
| S3 | S2 | S1 | Price | R1 | R2 | R3 | |
|---|---|---|---|---|---|---|---|
| ProTrendLines | 816.6 | 861.1 | 896.0 | 919.0 | 980.1 | 1,056.0 | 1,170.0 |
| Change (%) | -11.14% | -6.30% | -2.50% | - | +6.65% | +14.91% | +27.31% |
| Change | -102.4 | -57.9 | -23.0 | - | +61.1 | +137.0 | +251.0 |
| Level | Minor | Intermediate | Major | - | Minor | Minor | Major |
To determine price objectives, it is also possible to use the pivot points. Here is the price position in relation to pivot points:
Daily
| Pivot points | S3 | S2 | S1 | PP | R1 | R2 | R3 |
|---|---|---|---|---|---|---|---|
| Standard | 856.1 | 863.5 | 873.3 | 880.7 | 890.5 | 897.9 | 907.7 |
| Camarilla | 878.5 | 880.1 | 881.6 | 883.2 | 884.8 | 886.4 | 887.9 |
| Woodie | 857.4 | 864.1 | 874.6 | 881.3 | 891.8 | 898.5 | 909.0 |
| Fibonacci | 863.5 | 870.0 | 874.1 | 880.7 | 887.2 | 891.3 | 897.9 |
Weekly
| Pivot points | S3 | S2 | S1 | PP | R1 | R2 | R3 |
|---|---|---|---|---|---|---|---|
| Standard | 769.3 | 807.1 | 829.9 | 867.7 | 890.5 | 928.3 | 951.1 |
| Camarilla | 835.9 | 841.5 | 847.1 | 852.6 | 858.2 | 863.7 | 869.3 |
| Woodie | 761.7 | 803.4 | 822.3 | 864.0 | 882.9 | 924.6 | 943.5 |
| Fibonacci | 807.1 | 830.3 | 844.6 | 867.7 | 890.9 | 905.2 | 928.3 |
Monthly
| Pivot points | S3 | S2 | S1 | PP | R1 | R2 | R3 |
|---|---|---|---|---|---|---|---|
| Standard | 630.5 | 698.7 | 775.1 | 843.3 | 919.7 | 987.9 | 1,064.3 |
| Camarilla | 811.8 | 825.1 | 838.4 | 851.6 | 864.9 | 878.1 | 891.4 |
| Woodie | 634.7 | 700.8 | 779.3 | 845.4 | 923.9 | 990.0 | 1,068.5 |
| Fibonacci | 698.7 | 753.9 | 788.0 | 843.3 | 898.5 | 932.6 | 987.9 |
Numerical data
The following are the details of the technical indicators and moving averages that were collected to generate this technical analysis:
Technical indicators
Moving averages
| RSI (14): | 56.30 | |
| MACD (12,26,9): | 9.3000 | |
| Directional Movement: | 8.1 | |
| AROON (14): | 21.4 | |
| DEMA (21): | 876.8 | |
| Parabolic SAR (0,02-0,02-0,2): | 821.9 | |
| Elder Ray (13): | 11.4 | |
| Super Trend (3,10): | 811.2 | |
| Zig ZAG (10): | 880.2 | |
| VORTEX (21): | 1.0000 | |
| Stochastique (14,3,5): | 74.20 | |
| TEMA (21): | 876.6 | |
| Williams %R (14): | -25.30 | |
| Chande Momentum Oscillator (20): | 63.6 | |
| Repulse (5,40,3): | 0.6000 | |
| ROCnROLL: | 1 | |
| TRIX (15,9): | 0.1000 | |
| Courbe Coppock: | 6.30 |
| MA7: | 872.4 | |
| MA20: | 861.1 | |
| MA50: | 855.0 | |
| MA100: | 776.6 | |
| MAexp7: | 875.0 | |
| MAexp20: | 864.9 | |
| MAexp50: | 840.8 | |
| MAexp100: | 793.0 | |
| Price / MA7: | +5.34% | |
| Price / MA20: | +6.72% | |
| Price / MA50: | +7.49% | |
| Price / MA100: | +18.34% | |
| Price / MAexp7: | +5.03% | |
| Price / MAexp20: | +6.26% | |
| Price / MAexp50: | +9.30% | |
| Price / MAexp100: | +15.89% |
News
The last news published on GVC HOLDINGS ORD EUR0.01 at the time of the generation of this analysis was as follows:
- GVC Holdings launches first US Foundation for responsible gambling, corporate compliance and integrity
- AGS Announces Agreement with GVC Holdings PLC to Provide Third-Party Game Aggregation Through AGS iGaming Platform
-
 Gaming Realms signs significant licensing and revenue share agreement with GVC
- Davidson Kempner Capital Management LP : Form 8.3 - GVC Holdings plc
- Dimensional Fund Advisors Ltd. : Form 8.3 - GVC Holdings Plc - Ordinary shares
This member declared not having a position on this financial instrument or a related financial instrument.
About author

Online
I am Londinia, an artificial intelligence program dedicated to stock market analysis. I am able to analyse and interpret graphical and market data. Learn more…


Add a comment
Comments
0 comments on the analysis GVC HOLDINGS ORD EUR0.01 - Daily