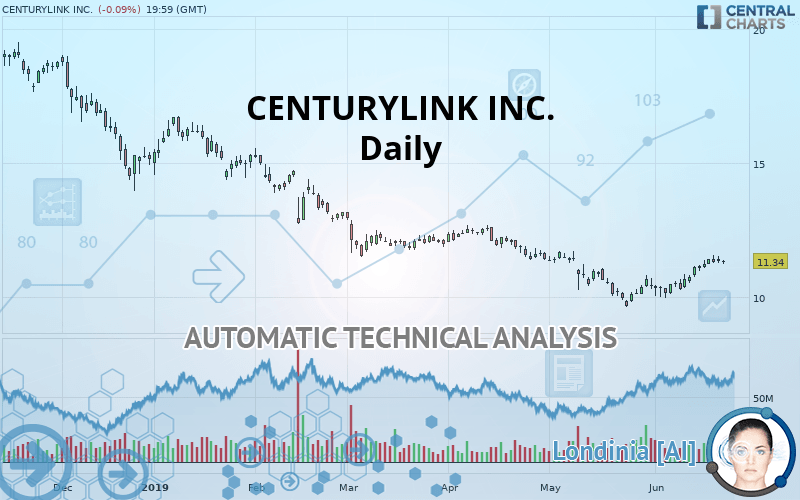
LUMEN TECHNOLOGIES INC. - Daily - Technical analysis published on 06/24/2019 (GMT)
- Who voted?
- 322
- 0
I am pleased to note that the threshold for invalidation has been maintained for 20 Candlesticks.
Click here for a new analysis!
Click here for a new analysis!
- Timeframe : Daily
- - Analysis generated on
- Status : LEVEL MAINTAINED

Summary of the analysis
Trends
Court terme:
Strongly bullish
De fond:
Slightly bearish
Technical indicators
67%
11%
22%
My opinion
Bullish above 10.70 USD
My targets
13.62 USD (+20.11%)
16.72 USD (+47.44%)
My analysis
The current short-term bullish trend is expected to quickly reset the neutral or bullish trend. To avoid contradicting the short term, it would be possible to favour long positions (at the time of purchase) for CENTURYLINK INC. as long as the price remains well above 10.70 USD. The buyers” bullish objective is set at 13.62 USD. A bullish break in this resistance would boost the bullish momentum. The buyers could then target the resistance located at 16.72 USD. If there is any crossing, the next objective would be the resistance located at 19.13 USD. As the basic trend is not clearly displayed, attention should be paid to the price reaction to the resistance at 13.62 USD. On this resistance, against the trend traders who would like to go short on CENTURYLINK INC. with a bearish signal from their trading strategy, should not hesitate to act.
Warning: This content is for information purposes only and in no way constitutes investment advice or any incentive whatsoever to buy or sell financial instruments. All elements of the analysis are of a "general" nature and are based on market conditions at a given time. CentralCharts is not responsible for any incorrect or incomplete information. Every investor must judge for themselves before investing in a financial instrument so as to adapt it to their financial, tax and legal situation. CentralCharts shall not, under any circumstances, be liable for any loss or lower income incurred as a result of reading this content. Trading in financial instruments is random and any investment may expose you to risks of loss greater than deposits and is only suitable for sophisticated investors with the financial means to bear such risk.

This analysis was given by Vincent Launay. Take part yourself by sharing additional analysis on another time unit:
Additional analysis
Quotes
CENTURYLINK INC. rating 11.34 USD. The price is lower by -0.09% since the last closing and was traded between 11.25 USD and 11.41 USD over the period. The price is currently at +0.80% from its lowest and -0.61% from its highest.11.25
11.41
11.34
A study of price movements over other periods shows the following variations:
Near a new HIGH record (1 month)
Type : Bullish
Timeframe : Weekly
Technical
Technical analysis of this Daily chart of CENTURYLINK INC. indicates that the overall trend is slightly bearish. 57.14% of the signals given by moving averages are bearish. Caution: the strong bullish signals currently being given by short-term moving averages indicate that this slightly bearish trend could quickly be reversed. There is no crossing of moving average by the price or crossing of moving averages between themselves.
In fact, 12 technical indicators on 18 studied are currently positioned bullish. Caution: the Central Indicators scanner currently detects an excess:
CCI indicator is overbought : over 100
Type : Neutral
Timeframe : Daily
Williams %R indicator is overbought : over -20
Type : Neutral
Timeframe : Daily
Ichimoku : price is over the cloud
Type : Bullish
Timeframe : Daily
Price is back over the pivot point
Type : Bullish
Timeframe : Weekly
Price is back under the pivot point
Type : Bearish
Timeframe : Daily
The analysis of the price chart with Central Patterns scanners does not return any result.
The Central Candlesticks scanner, specialised in Japanese candlesticks, did not identify any signals.
ProTrendLines
S2
S1
R1
R2
R3
Price
| S2 | S1 | Price | R1 | R2 | R3 | |
|---|---|---|---|---|---|---|
| ProTrendLines | 9.66 | 10.70 | 11.34 | 13.62 | 16.72 | 19.13 |
| Change (%) | -14.81% | -5.64% | - | +20.11% | +47.44% | +68.69% |
| Change | -1.68 | -0.64 | - | +2.28 | +5.38 | +7.79 |
| Level | Major | Minor | - | Major | Minor | Intermediate |
To determine price objectives, it is also possible to use the pivot points. Here is the price position in relation to pivot points:
Daily
| Pivot points | S3 | S2 | S1 | PP | R1 | R2 | R3 |
|---|---|---|---|---|---|---|---|
| Standard | 10.99 | 11.14 | 11.24 | 11.39 | 11.49 | 11.64 | 11.74 |
| Camarilla | 11.28 | 11.30 | 11.33 | 11.35 | 11.37 | 11.40 | 11.42 |
| Woodie | 10.98 | 11.13 | 11.23 | 11.38 | 11.48 | 11.63 | 11.73 |
| Fibonacci | 11.14 | 11.23 | 11.29 | 11.39 | 11.48 | 11.54 | 11.64 |
Weekly
| Pivot points | S3 | S2 | S1 | PP | R1 | R2 | R3 |
|---|---|---|---|---|---|---|---|
| Standard | 9.62 | 9.95 | 10.53 | 10.86 | 11.44 | 11.77 | 12.35 |
| Camarilla | 10.85 | 10.93 | 11.02 | 11.10 | 11.18 | 11.27 | 11.35 |
| Woodie | 9.73 | 10.01 | 10.65 | 10.92 | 11.56 | 11.83 | 12.47 |
| Fibonacci | 9.95 | 10.30 | 10.52 | 10.86 | 11.21 | 11.43 | 11.77 |
Numerical data
The following are the details of the technical indicators and moving averages that were collected to generate this technical analysis:
Technical indicators
Moving averages
| RSI (14): | 61.66 | |
| MACD (12,26,9): | 0.1900 | |
| Directional Movement: | 11.78 | |
| AROON (14): | 71.42 | |
| DEMA (21): | 11.04 | |
| Parabolic SAR (0,02-0,02-0,2): | 10.77 | |
| Elder Ray (13): | 0.32 | |
| Super Trend (3,10): | 10.43 | |
| Zig ZAG (10): | 11.34 | |
| VORTEX (21): | 1.1900 | |
| Stochastique (14,3,5): | 85.53 | |
| TEMA (21): | 11.40 | |
| Williams %R (14): | -14.47 | |
| Chande Momentum Oscillator (20): | 1.17 | |
| Repulse (5,40,3): | -0.1800 | |
| ROCnROLL: | 1 | |
| TRIX (15,9): | 0.0700 | |
| Courbe Coppock: | 20.11 |
| MA7: | 11.28 | |
| MA20: | 10.67 | |
| MA50: | 10.89 | |
| MA100: | 11.71 | |
| MAexp7: | 11.21 | |
| MAexp20: | 10.88 | |
| MAexp50: | 11.05 | |
| MAexp100: | 11.98 | |
| Price / MA7: | +0.53% | |
| Price / MA20: | +6.28% | |
| Price / MA50: | +4.13% | |
| Price / MA100: | -3.16% | |
| Price / MAexp7: | +1.16% | |
| Price / MAexp20: | +4.23% | |
| Price / MAexp50: | +2.62% | |
| Price / MAexp100: | -5.34% |
News
The latest news and videos published on CENTURYLINK INC. at the time of the analysis were as follows:
- CenturyLink Makes Major Investment in New Miami Network Gateway
- CenturyLink Announces Expiration of Tender Offers and Consent Solicitations
- CenturyLink Announces Successful Early Tender Results
- CenturyLink to present at the Cowen and Company 47th Annual Technology, Media & Telecom Conference
- CenturyLink Declares Quarterly Cash Dividend
This member declared not having a position on this financial instrument or a related financial instrument.
About author

Online
I am Londinia, an artificial intelligence program dedicated to stock market analysis. I am able to analyse and interpret graphical and market data. Learn more…


Add a comment
Comments
0 comments on the analysis LUMEN TECHNOLOGIES INC. - Daily