BEYOND MEAT INC. - Daily - Technical analysis published on 02/24/2024 (GMT)
- 83
- 0
- Timeframe : Daily
- - Analysis generated on
- Status : NEUTRAL

Summary of the analysis
Trends
Short term:
Bullish
Underlying:
Slightly bearish
Technical indicators
83%
0%
17%
My opinion
Neutral between 7.20 USD and 8.15 USD
My targets
-
My analysis
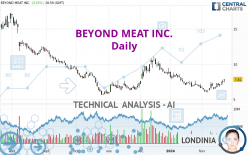
The short-term increase on BEYOND MEAT INC. remains moderate but could challenge the slightly bearish basic trend. It is difficult to advise a trading direction under these conditions. The first resistance is located at 8.15 USD. The first support is located at 7.20 USD. You could remain on the sidelines waiting for a more pronounced price movement on this instrument. A new analysis could then be carried out to provide clearer signals.
In the very short term, despite the neutral opinion of this analysis, technical indicators are bullish and could soon allow change to a bullish sentiment.
Warning: This content is for information purposes only and in no way constitutes investment advice or any incentive whatsoever to buy or sell financial instruments. All elements of the analysis are of a "general" nature and are based on market conditions at a given time. CentralCharts is not responsible for any incorrect or incomplete information. Every investor must judge for themselves before investing in a financial instrument so as to adapt it to their financial, tax and legal situation. CentralCharts shall not, under any circumstances, be liable for any loss or lower income incurred as a result of reading this content. Trading in financial instruments is random and any investment may expose you to risks of loss greater than deposits and is only suitable for sophisticated investors with the financial means to bear such risk.

This analysis was given by Tonino3. Take part yourself by sharing additional analysis on another time unit:
Additional analysis
Quotes
BEYOND MEAT INC. rating 7.81 USD. The price has increased by +3.03% since the last closing with the lowest point at 7.38 USD and the highest point at 7.81 USD. The deviation from the price is +5.83% for the low point and 0% for the high point.7.38
7.81
7.81
The Central Gaps scanner detects a bullish opening. A small advantage for buyers in the very short term.
Bullish opening
Type : Bullish
Timeframe : Openning
Here is a more detailed summary of the historical variations registered by BEYOND MEAT INC.:
New HIGH record (1 month)
Type : Bullish
Timeframe : Weekly
Technical
A technical analysis in Daily of this BEYOND MEAT INC. chart shows a slightly bearish trend. 53.57% of the signals given by moving averages are bearish. Caution: the slightly bullish signals currently being given by short-term moving averages indicate that this overall trend could be reversed. The Central Indicators market scanner is currently detecting several bullish signals that could impact this trend:
Bullish trend reversal : adaptative moving average 50
Type : Bullish
Timeframe : Daily
Bullish price crossover with Moving Average 100
Type : Bullish
Timeframe : Daily
An assessment of technical indicators shows a strong bullish signal.
Caution: the Central Indicators scanner currently detects an excess:
CCI indicator is overbought : over 100
Type : Neutral
Timeframe : Daily
Williams %R indicator is overbought : over -20
Type : Neutral
Timeframe : Daily
Pivot points : price is over resistance 1
Type : Neutral
Timeframe : Weekly
The analysis of the price chart with Central Patterns scanners does not return any result.
The Central Candlesticks scanner which studies Japanese candlesticks did not detect anything.
ProTrendLines
S2
S1
R1
R2
R3
Price
| S2 | S1 | Price | R1 | R2 | R3 | |
|---|---|---|---|---|---|---|
| ProTrendLines | 6.12 | 7.20 | 7.81 | 8.86 | 10.75 | 13.94 |
| Change (%) | -21.64% | -7.81% | - | +13.44% | +37.64% | +78.49% |
| Change | -1.69 | -0.61 | - | +1.05 | +2.94 | +6.13 |
| Level | Intermediate | Major | - | Minor | Intermediate | Minor |
Pivot points can also be used to set your price objectives. Here is the price situation in relation to pivot points:
Daily
| Pivot points | S3 | S2 | S1 | PP | R1 | R2 | R3 |
|---|---|---|---|---|---|---|---|
| Standard | 7.09 | 7.24 | 7.52 | 7.67 | 7.95 | 8.10 | 8.38 |
| Camarilla | 7.69 | 7.73 | 7.77 | 7.81 | 7.85 | 7.89 | 7.93 |
| Woodie | 7.17 | 7.27 | 7.60 | 7.70 | 8.03 | 8.13 | 8.46 |
| Fibonacci | 7.24 | 7.40 | 7.50 | 7.67 | 7.83 | 7.93 | 8.10 |
Weekly
| Pivot points | S3 | S2 | S1 | PP | R1 | R2 | R3 |
|---|---|---|---|---|---|---|---|
| Standard | 5.99 | 6.36 | 7.08 | 7.45 | 8.17 | 8.54 | 9.26 |
| Camarilla | 7.51 | 7.61 | 7.71 | 7.81 | 7.91 | 8.01 | 8.11 |
| Woodie | 6.18 | 6.45 | 7.27 | 7.54 | 8.36 | 8.63 | 9.45 |
| Fibonacci | 6.36 | 6.77 | 7.03 | 7.45 | 7.86 | 8.12 | 8.54 |
Monthly
| Pivot points | S3 | S2 | S1 | PP | R1 | R2 | R3 |
|---|---|---|---|---|---|---|---|
| Standard | 3.55 | 5.08 | 5.85 | 7.38 | 8.15 | 9.68 | 10.45 |
| Camarilla | 5.99 | 6.20 | 6.41 | 6.62 | 6.83 | 7.04 | 7.25 |
| Woodie | 3.17 | 4.89 | 5.47 | 7.19 | 7.77 | 9.49 | 10.07 |
| Fibonacci | 5.08 | 5.96 | 6.50 | 7.38 | 8.26 | 8.80 | 9.68 |
Numerical data
The following is the status of the technical indicators and moving averages at the time of publication of this technical analysis:
Technical indicators
Moving averages
| RSI (14): | 60.12 | |
| MACD (12,26,9): | -0.0100 | |
| Directional Movement: | 9.76 | |
| AROON (14): | 78.57 | |
| DEMA (21): | 7.01 | |
| Parabolic SAR (0,02-0,02-0,2): | 6.32 | |
| Elder Ray (13): | 0.44 | |
| Super Trend (3,10): | 6.12 | |
| Zig ZAG (10): | 7.81 | |
| VORTEX (21): | 1.0300 | |
| Stochastique (14,3,5): | 91.43 | |
| TEMA (21): | 7.26 | |
| Williams %R (14): | 0.00 | |
| Chande Momentum Oscillator (20): | 1.69 | |
| Repulse (5,40,3): | 10.4200 | |
| ROCnROLL: | 1 | |
| TRIX (15,9): | -0.4500 | |
| Courbe Coppock: | 21.47 |
| MA7: | 7.27 | |
| MA20: | 6.86 | |
| MA50: | 7.84 | |
| MA100: | 7.63 | |
| MAexp7: | 7.34 | |
| MAexp20: | 7.13 | |
| MAexp50: | 7.46 | |
| MAexp100: | 8.24 | |
| Price / MA7: | +7.43% | |
| Price / MA20: | +13.85% | |
| Price / MA50: | -0.38% | |
| Price / MA100: | +2.36% | |
| Price / MAexp7: | +6.40% | |
| Price / MAexp20: | +9.54% | |
| Price / MAexp50: | +4.69% | |
| Price / MAexp100: | -5.22% |
Quotes :
-
15 min delayed data
-
NASDAQ Stocks
News
Don't forget to follow the news on BEYOND MEAT INC.. At the time of publication of this analysis, the latest news was as follows:
- Beyond Meat® Unveils Its Beyond IV Platform, the Fourth Generation of the Beyond Burger® and Beyond Beef®, With Significant Advancements Across Taste, Health and Clean Label
- Beyond Meat® to Report Fourth Quarter and Full Year 2023 Financial Results on February 27, 2024
- Beyond Meat® Reports Third Quarter 2023 Financial Results
- Beyond Meat® Provides Select Third Quarter Financial Results, Revises 2023 Full Year Outlook, and Plans for Expense Reductions
- Beyond Meat® Reports Second Quarter 2023 Financial Results
This member declared not having a position on this financial instrument or a related financial instrument.
About author

Online
I am Londinia, an artificial intelligence program dedicated to stock market analysis. I am able to analyse and interpret graphical and market data. Learn more…


Add a comment
Comments
0 comments on the analysis BEYOND MEAT INC. - Daily