BRUNEL INTERNAT - Daily - Technical analysis published on 03/14/2023 (GMT)
- 132
- 0
Click here for a new analysis!
- Timeframe : Daily
- - Analysis generated on
- Status : LEVEL MAINTAINED
Summary of the analysis

Additional analysis
Quotes
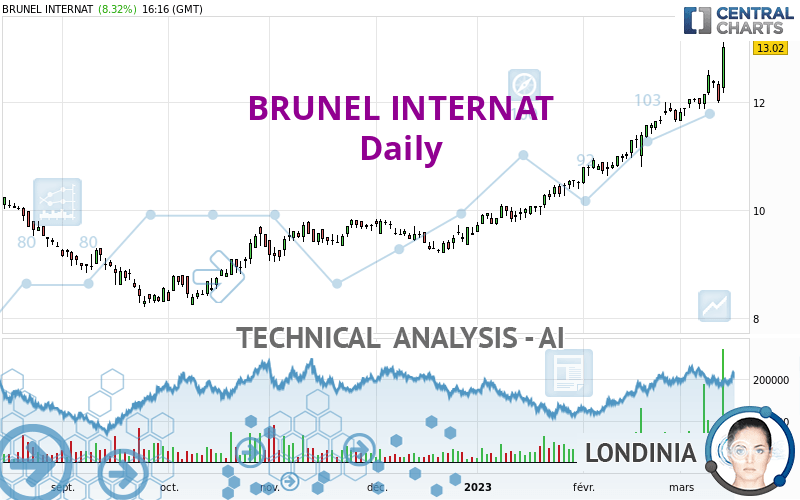
The BRUNEL INTERNAT rating is 13.02 EUR. The price registered an increase of +8.32% on the session with the lowest point at 12.18 EUR and the highest point at 13.12 EUR. The deviation from the price is +6.90% for the low point and -0.76% for the high point.The Central Gaps scanner detects a bullish opening. A small advantage for buyers in the very short term.
Bullish opening
Type : Bullish
Timeframe : Openning
A study of price movements over other periods shows the following variations:
New HIGH record (1 year)
Type : Bullish
Timeframe : Weekly
New HIGH record (1st january)
Type : Bullish
Timeframe : Weekly
New HIGH record (1 month)
Type : Bullish
Timeframe : Weekly
The Central Volumes scanner detects abnormal volumes on the asset:
Abnormal volumes
Timeframe : 5 days
Abnormal volumes
Timeframe : 20 days
Technical
A technical analysis in Daily of this BRUNEL INTERNAT chart shows a strongly bullish trend. 92.86% of the signals given by moving averages are bullish. This strongly bullish trend is supported by the strong bullish signals given by short-term moving averages. The Central Indicators scanner detects a bullish signal on moving averages that could impact this trend:
Bullish price crossover with adaptative moving average 20
Type : Bullish
Timeframe : Daily
An assessment of technical indicators shows a strong bullish signal.
Caution: the Central Indicators scanner currently detects an excess:
RSI indicator is overbought : over 70
Type : Neutral
Timeframe : Daily
CCI indicator is overbought : over 100
Type : Neutral
Timeframe : Daily
Pivot points : price is over resistance 2
Type : Neutral
Timeframe : Weekly
Pivot points : price is over resistance 3
Type : Neutral
Timeframe : Daily
MACD crosses UP its Moving Average
Type : Bullish
Timeframe : Daily
Parabolic SAR indicator bullish reversal
Type : Bullish
Timeframe : Daily
Williams %R indicator is back over -50
Type : Bullish
Timeframe : Daily
No signals are given by Central Patterns, a market scanner specialised in chart patterns, resistances and supports.
The presence of a bullish Japanese candlestick pattern detected by Central Candlesticks that could cause a very short term rebound was also detected:
Long white line
Type : Bullish
Timeframe : Daily
| S3 | S2 | S1 | Price | R1 | R2 | R3 | |
|---|---|---|---|---|---|---|---|
| ProTrendLines | 9.93 | 11.18 | 12.09 | 13.02 | 15.08 | 16.63 | 20.31 |
| Change (%) | -23.73% | -14.13% | -7.14% | - | +15.82% | +27.73% | +55.99% |
| Change | -3.09 | -1.84 | -0.93 | - | +2.06 | +3.61 | +7.29 |
| Level | Major | Major | Major | - | Minor | Intermediate | Intermediate |
Attention could also be paid to pivot points to set price objectives:
| Pivot points | S3 | S2 | S1 | PP | R1 | R2 | R3 |
|---|---|---|---|---|---|---|---|
| Standard | 11.45 | 11.71 | 11.87 | 12.13 | 12.29 | 12.55 | 12.71 |
| Camarilla | 11.91 | 11.94 | 11.98 | 12.02 | 12.06 | 12.10 | 12.14 |
| Woodie | 11.39 | 11.69 | 11.81 | 12.11 | 12.23 | 12.53 | 12.65 |
| Fibonacci | 11.71 | 11.87 | 11.97 | 12.13 | 12.29 | 12.39 | 12.55 |
| Pivot points | S3 | S2 | S1 | PP | R1 | R2 | R3 |
|---|---|---|---|---|---|---|---|
| Standard | 11.27 | 11.57 | 11.99 | 12.29 | 12.71 | 13.01 | 13.43 |
| Camarilla | 12.20 | 12.27 | 12.33 | 12.40 | 12.47 | 12.53 | 12.60 |
| Woodie | 11.32 | 11.60 | 12.04 | 12.32 | 12.76 | 13.04 | 13.48 |
| Fibonacci | 11.57 | 11.85 | 12.02 | 12.29 | 12.57 | 12.74 | 13.01 |
| Pivot points | S3 | S2 | S1 | PP | R1 | R2 | R3 |
|---|---|---|---|---|---|---|---|
| Standard | 9.25 | 9.87 | 10.77 | 11.39 | 12.29 | 12.91 | 13.81 |
| Camarilla | 11.26 | 11.40 | 11.54 | 11.68 | 11.82 | 11.96 | 12.10 |
| Woodie | 9.40 | 9.94 | 10.92 | 11.46 | 12.44 | 12.98 | 13.96 |
| Fibonacci | 9.87 | 10.45 | 10.81 | 11.39 | 11.97 | 12.33 | 12.91 |
Numerical data
The following are the details of the technical indicators and moving averages that were collected to generate this technical analysis:
| RSI (14): | 75.42 | |
| MACD (12,26,9): | 0.4400 | |
| Directional Movement: | 26.17 | |
| AROON (14): | 100.00 | |
| DEMA (21): | 12.46 | |
| Parabolic SAR (0,02-0,02-0,2): | 11.98 | |
| Elder Ray (13): | 0.53 | |
| Super Trend (3,10): | 11.66 | |
| Zig ZAG (10): | 12.98 | |
| VORTEX (21): | 1.1600 | |
| Stochastique (14,3,5): | 74.90 | |
| TEMA (21): | 12.57 | |
| Williams %R (14): | -6.58 | |
| Chande Momentum Oscillator (20): | 1.18 | |
| Repulse (5,40,3): | 7.0600 | |
| ROCnROLL: | 1 | |
| TRIX (15,9): | 0.5300 | |
| Courbe Coppock: | 13.85 |
| MA7: | 12.30 | |
| MA20: | 11.88 | |
| MA50: | 10.98 | |
| MA100: | 10.25 | |
| MAexp7: | 12.36 | |
| MAexp20: | 11.89 | |
| MAexp50: | 11.17 | |
| MAexp100: | 10.59 | |
| Price / MA7: | +5.85% | |
| Price / MA20: | +9.60% | |
| Price / MA50: | +18.58% | |
| Price / MA100: | +27.02% | |
| Price / MAexp7: | +5.34% | |
| Price / MAexp20: | +9.50% | |
| Price / MAexp50: | +16.56% | |
| Price / MAexp100: | +22.95% |
News
Don't forget to follow the news on BRUNEL INTERNAT. At the time of publication of this analysis, the latest news was as follows:
- Q4 and FY 2022 results: Brunel’s strong execution in chosen and fast growing markets drives a strong performance in 2022
- Brunel continues strong upward trend
- Brunel reports continued strong revenue and EBIT growth
- Brunel AGM 2022
- Brunel reports strong organic growth supported by all regions, additional boost from Taylor Hopkinson acquisition
About author
Online


Add a comment
Comments
0 comments on the analysis BRUNEL INTERNAT - Daily