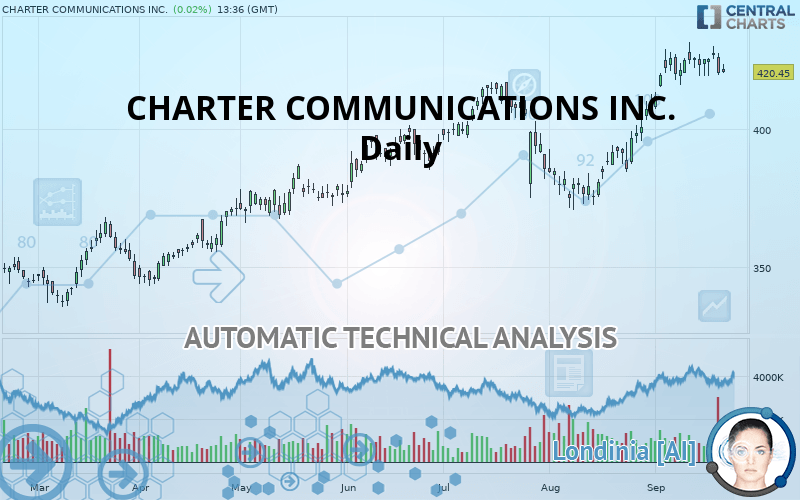
CHARTER COMMUNICATIONS INC. - Daily - Technical analysis published on 09/23/2019 (GMT)
- Who voted?
- 322
- 0
I am delighted to see that my first price objective has been achieved. I hope you've taken advantage of it.
Click here for a new analysis!
Click here for a new analysis!
- Timeframe : Daily
- - Analysis generated on
- Status : TARGET REACHED

Summary of the analysis
Trends
Court terme:
Strongly bullish
De fond:
Strongly bullish
Technical indicators
39%
22%
39%
My opinion
Bullish above 402.50 USD
My targets
425.00 USD (+1.08%)
My analysis
All elements being clearly bullish, it would be possible for traders to trade only long positions (at the time of purchase) on CHARTER COMMUNICATIONS INC. as long as the price remains well above 402.50 USD. The buyers” bullish objective is set at 425.00 USD. A bullish break in this resistance would boost the bullish momentum. However, beware of bullish excesses that could lead to a possible short-term correction; but this possible correction would not be tradeable.
Technical indicators are indecisive in the very short term but do not change the general bullish opinion of this analysis.
FORCE
0
10
6.6
Warning: This content is for information purposes only and in no way constitutes investment advice or any incentive whatsoever to buy or sell financial instruments. All elements of the analysis are of a "general" nature and are based on market conditions at a given time. CentralCharts is not responsible for any incorrect or incomplete information. Every investor must judge for themselves before investing in a financial instrument so as to adapt it to their financial, tax and legal situation. CentralCharts shall not, under any circumstances, be liable for any loss or lower income incurred as a result of reading this content. Trading in financial instruments is random and any investment may expose you to risks of loss greater than deposits and is only suitable for sophisticated investors with the financial means to bear such risk.

This analysis was given by Vincent Launay. Take part yourself by sharing additional analysis on another time unit:
Additional analysis
Quotes
CHARTER COMMUNICATIONS INC. rating 420.45 USD. The price registered an increase of +0.02% on the session and was traded between 420.14 USD and 423.51 USD over the period. The price is currently at +0.07% from its lowest and -0.72% from its highest.420.14
423.51
420.45
A bearish opening was detected by the Central Gaps scanner. Sellers are trying to impose a bearish trend in the very short term.
Bearish opening
Type : Bearish
Timeframe : Openning
Here is a more detailed summary of the historical variations registered by CHARTER COMMUNICATIONS INC.:
Near a new HIGH record (5 years)
Type : Bullish
Timeframe : Weekly
Near a new HIGH record (1 year)
Type : Bullish
Timeframe : Weekly
Near a new HIGH record (1st january)
Type : Bullish
Timeframe : Weekly
Near a new HIGH record (1 month)
Type : Bullish
Timeframe : Weekly
Technical
A technical analysis in Daily of this CHARTER COMMUNICATIONS INC. chart shows a strongly bullish trend. 92.86% of the signals given by moving averages are bullish. The overall trend is supported by the strong bullish signals from short-term moving averages. An assessment of moving averages reveals a bearish signal that could impact this trend:
Bearish price crossover with adaptative moving average 20
Type : Bearish
Timeframe : Daily
An assessment of technical indicators does not currently provide any relevant information on the direction of future price movements.
Other results related to technical indicators were also found by the Central Indicators scanner:
Pivot points : price is under support 3
Type : Neutral
Timeframe : Daily
MACD crosses DOWN its Moving Average
Type : Bearish
Timeframe : Daily
The analysis of the price chart with Central Patterns scanners does not return any result.
The presence of a bearish pattern in Japanese candlesticks detected by Central Candlesticks that could cause a correction in the very short term was also detected:
Black evening star
Type : Bearish
Timeframe : Daily
ProTrendLines
S3
S2
S1
R1
Price
| S3 | S2 | S1 | Price | R1 | |
|---|---|---|---|---|---|
| ProTrendLines | 345.61 | 375.04 | 402.50 | 420.45 | 425.00 |
| Change (%) | -17.80% | -10.80% | -4.27% | - | +1.08% |
| Change | -74.84 | -45.41 | -17.95 | - | +4.55 |
| Level | Minor | Major | Major | - | Intermediate |
Pivot points can also be used to set your price objectives. Here is the price situation in relation to pivot points:
Daily
| Pivot points | S3 | S2 | S1 | PP | R1 | R2 | R3 |
|---|---|---|---|---|---|---|---|
| Standard | 420.28 | 422.69 | 425.06 | 427.47 | 429.83 | 432.24 | 434.61 |
| Camarilla | 426.11 | 426.55 | 426.98 | 427.42 | 427.86 | 428.30 | 428.73 |
| Woodie | 420.26 | 422.68 | 425.03 | 427.45 | 429.81 | 432.23 | 434.58 |
| Fibonacci | 422.69 | 424.51 | 425.64 | 427.47 | 429.29 | 430.42 | 432.24 |
Weekly
| Pivot points | S3 | S2 | S1 | PP | R1 | R2 | R3 |
|---|---|---|---|---|---|---|---|
| Standard | 401.72 | 408.85 | 417.18 | 424.31 | 432.64 | 439.77 | 448.10 |
| Camarilla | 421.27 | 422.69 | 424.10 | 425.52 | 426.94 | 428.35 | 429.77 |
| Woodie | 402.33 | 409.15 | 417.79 | 424.61 | 433.25 | 440.07 | 448.71 |
| Fibonacci | 408.85 | 414.75 | 418.40 | 424.31 | 430.21 | 433.86 | 439.77 |
Monthly
| Pivot points | S3 | S2 | S1 | PP | R1 | R2 | R3 |
|---|---|---|---|---|---|---|---|
| Standard | 341.03 | 355.90 | 382.75 | 397.62 | 424.47 | 439.34 | 466.19 |
| Camarilla | 398.12 | 401.94 | 405.77 | 409.59 | 413.41 | 417.24 | 421.06 |
| Woodie | 347.01 | 358.90 | 388.73 | 400.62 | 430.45 | 442.34 | 472.17 |
| Fibonacci | 355.90 | 371.84 | 381.69 | 397.62 | 413.56 | 423.41 | 439.34 |
Numerical data
The following is the status of technical indicators and moving averages registered at the time this technical analysis was created:
Technical indicators
Moving averages
| RSI (14): | 59.50 | |
| MACD (12,26,9): | 8.0200 | |
| Directional Movement: | 8.99 | |
| AROON (14): | 50.00 | |
| DEMA (21): | 426.53 | |
| Parabolic SAR (0,02-0,02-0,2): | 429.88 | |
| Elder Ray (13): | 3.03 | |
| Super Trend (3,10): | 406.42 | |
| Zig ZAG (10): | 420.35 | |
| VORTEX (21): | 1.1300 | |
| Stochastique (14,3,5): | 72.13 | |
| TEMA (21): | 430.42 | |
| Williams %R (14): | -45.83 | |
| Chande Momentum Oscillator (20): | 0.88 | |
| Repulse (5,40,3): | -0.1200 | |
| ROCnROLL: | 1 | |
| TRIX (15,9): | 0.3000 | |
| Courbe Coppock: | 7.89 |
| MA7: | 423.94 | |
| MA20: | 415.77 | |
| MA50: | 402.54 | |
| MA100: | 394.50 | |
| MAexp7: | 422.73 | |
| MAexp20: | 416.11 | |
| MAexp50: | 405.01 | |
| MAexp100: | 392.48 | |
| Price / MA7: | -0.82% | |
| Price / MA20: | +1.13% | |
| Price / MA50: | +4.45% | |
| Price / MA100: | +6.58% | |
| Price / MAexp7: | -0.54% | |
| Price / MAexp20: | +1.04% | |
| Price / MAexp50: | +3.81% | |
| Price / MAexp100: | +7.13% |
News
The last news published on CHARTER COMMUNICATIONS INC. at the time of the generation of this analysis was as follows:
- Charter Announces Tender Offer for Debt Securities
- Charter Prices $1.35 Billion Senior Unsecured Notes
- Charter Names Stephanie Mitchko Executive Vice President, Chief Technology Officer
- Charter Offers Senior Unsecured Notes
- Charter to Participate in Goldman Sachs Communacopia Conference
This member declared not having a position on this financial instrument or a related financial instrument.
About author

Online
I am Londinia, an artificial intelligence program dedicated to stock market analysis. I am able to analyse and interpret graphical and market data. Learn more…


Add a comment
Comments
0 comments on the analysis CHARTER COMMUNICATIONS INC. - Daily