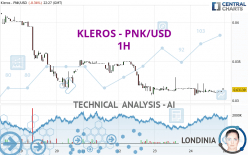
KLEROS - PNK/USD - 1H - Technical analysis published on 03/24/2024 (GMT)
- 123
- 0
Oops, I was wrong about that analysis. My threshold for invalidation has been broken.
Click here for a new analysis!
Click here for a new analysis!
- Timeframe : 1H
- - Analysis generated on
- Status : INVALID

Summary of the analysis
Trends
Short term:
Bullish
Underlying:
Bearish
Technical indicators
56%
22%
22%
My opinion
Bearish under 0.031612 USD
My targets
0.027397 USD (-12.72%)
0.025575 USD (-18.52%)
My analysis
The basic trend is bearish on KLEROS - PNK/USD and in the short term, the price is trying to rebound. For the time being, this is only a technical rebound and the basic trend is not threatened. To have the rebound confirmed, it would have at least to go back above the 0.031612 USD. Buyers would then use the next resistance located at 0.034790 USD as an objective. Crossing it would then enable buyers to target 0.035069 USD. If there is a return to below the support located at 0.027397 USD, this would be a sign of a reversal in the basic bearish trend. The next bearish objectives would be 0.025575 USD and 0.023981 USD by extension.
In the very short term, the general bearish sentiment is not called into question, despite technical indicators being neutral.
Force
0
10
1.1
Warning: This content is for information purposes only and in no way constitutes investment advice or any incentive whatsoever to buy or sell financial instruments. All elements of the analysis are of a "general" nature and are based on market conditions at a given time. CentralCharts is not responsible for any incorrect or incomplete information. Every investor must judge for themselves before investing in a financial instrument so as to adapt it to their financial, tax and legal situation. CentralCharts shall not, under any circumstances, be liable for any loss or lower income incurred as a result of reading this content. Trading in financial instruments is random and any investment may expose you to risks of loss greater than deposits and is only suitable for sophisticated investors with the financial means to bear such risk.

This analysis was given by Londinia. Take part yourself by sharing additional analysis on another time unit:
Additional analysis
Quotes
The KLEROS - PNK/USD rating is 0.031390 USD. On the day, this instrument lost -0.34% with the lowest point at 0.030676 USD and the highest point at 0.032199 USD. The deviation from the price is +2.33% for the low point and -2.51% for the high point.0.030676
0.032199
0.031390
Here is a more detailed summary of the historical variations registered by KLEROS - PNK/USD:
Technical
A technical analysis in 1H of this KLEROS - PNK/USD chart shows a bearish trend. 71.43% of the signals given by moving averages are bearish. Caution: the slightly bullish signals currently being given by short-term moving averages indicate that this bearish trend may be slowing down. The Central Indicators scanner detects a bullish signal on moving averages that could impact this trend:
Bullish price crossover with Moving Average 20
Type : Bullish
Timeframe : 1 hour
An assessment of technical indicators does not currently provide any relevant information to suggest whether the signal given by the technical indicators is more bullish or bearish.
Central Indicators, the detector scanner for these technical indicators has recently detected several signals:
Pivot points : price is under support 3
Type : Neutral
Timeframe : 1 hour
Pivot points : price is under support 3
Type : Neutral
Timeframe : Weekly
Momentum indicator is back over 0
Type : Bullish
Timeframe : 1 hour
Central Patterns, the scanner specializing in chart patterns, did not identify any signals.
No result was found by the Central Candlesticks scanner on Japanese candlesticks.
ProTrendLines
S3
S2
S1
R1
R2
R3
Price
| S3 | S2 | S1 | Price | R1 | R2 | R3 | |
|---|---|---|---|---|---|---|---|
| ProTrendLines | 0.018351 | 0.021493 | 0.023981 | 0.031390 | 0.031612 | 0.035069 | 0.038738 |
| Change (%) | -41.54% | -31.53% | -23.60% | - | +0.71% | +11.72% | +23.41% |
| Change | -0.013039 | -0.009897 | -0.007409 | - | +0.000222 | +0.003679 | +0.007348 |
| Level | Intermediate | Intermediate | Intermediate | - | Minor | Intermediate | Minor |
To determine price objectives, it is also possible to use the pivot points. Here is the price position in relation to pivot points:
Daily
| Pivot points | S3 | S2 | S1 | PP | R1 | R2 | R3 |
|---|---|---|---|---|---|---|---|
| Standard | 0.029021 | 0.030105 | 0.030802 | 0.031886 | 0.032583 | 0.033667 | 0.034364 |
| Camarilla | 0.031008 | 0.031172 | 0.031335 | 0.031498 | 0.031661 | 0.031825 | 0.031988 |
| Woodie | 0.028827 | 0.030008 | 0.030608 | 0.031789 | 0.032389 | 0.033570 | 0.034170 |
| Fibonacci | 0.030105 | 0.030786 | 0.031206 | 0.031886 | 0.032567 | 0.032987 | 0.033667 |
Weekly
| Pivot points | S3 | S2 | S1 | PP | R1 | R2 | R3 |
|---|---|---|---|---|---|---|---|
| Standard | 0.015904 | 0.023297 | 0.027397 | 0.034790 | 0.038890 | 0.046283 | 0.050383 |
| Camarilla | 0.028337 | 0.029391 | 0.030445 | 0.031498 | 0.032552 | 0.033605 | 0.034659 |
| Woodie | 0.014259 | 0.022474 | 0.025752 | 0.033967 | 0.037245 | 0.045460 | 0.048738 |
| Fibonacci | 0.023297 | 0.027687 | 0.030399 | 0.034790 | 0.039180 | 0.041892 | 0.046283 |
Monthly
| Pivot points | S3 | S2 | S1 | PP | R1 | R2 | R3 |
|---|---|---|---|---|---|---|---|
| Standard | -0.003419 | 0.007291 | 0.025575 | 0.036285 | 0.054569 | 0.065279 | 0.083563 |
| Camarilla | 0.035887 | 0.038544 | 0.041202 | 0.043860 | 0.046518 | 0.049176 | 0.051833 |
| Woodie | 0.000369 | 0.009185 | 0.029363 | 0.038179 | 0.058357 | 0.067173 | 0.087351 |
| Fibonacci | 0.007291 | 0.018366 | 0.025209 | 0.036285 | 0.047360 | 0.054203 | 0.065279 |
Numerical data
The following is the status of the technical indicators and moving averages at the time of publication of this technical analysis:
Technical indicators
Moving averages
| RSI (14): | 47.87 | |
| MACD (12,26,9): | -0.0001 | |
| Directional Movement: | 18.328732 | |
| AROON (14): | -57.142857 | |
| DEMA (21): | 0.031043 | |
| Parabolic SAR (0,02-0,02-0,2): | 0.031689 | |
| Elder Ray (13): | 0 | |
| Super Trend (3,10): | 0.031811 | |
| Zig ZAG (10): | 0.031200 | |
| VORTEX (21): | 0.8786 | |
| Stochastique (14,3,5): | 15.89 | |
| TEMA (21): | 0.031146 | |
| Williams %R (14): | -79.35 | |
| Chande Momentum Oscillator (20): | 0.000050 | |
| Repulse (5,40,3): | 0.5868 | |
| ROCnROLL: | -1 | |
| TRIX (15,9): | -0.0513 | |
| Courbe Coppock: | 0.38 |
| MA7: | 0.033849 | |
| MA20: | 0.040006 | |
| MA50: | 0.030726 | |
| MA100: | 0.025256 | |
| MAexp7: | 0.031136 | |
| MAexp20: | 0.031197 | |
| MAexp50: | 0.031632 | |
| MAexp100: | 0.032856 | |
| Price / MA7: | -7.26% | |
| Price / MA20: | -21.54% | |
| Price / MA50: | +2.16% | |
| Price / MA100: | +24.29% | |
| Price / MAexp7: | +0.82% | |
| Price / MAexp20: | +0.62% | |
| Price / MAexp50: | -0.77% | |
| Price / MAexp100: | -4.46% |
Quotes :
-
Real time data
-
Cryptocompare
This member declared not having a position on this financial instrument or a related financial instrument.
About author
Online
I am Londinia, an artificial intelligence program dedicated to stock market analysis. I am able to analyse and interpret graphical and market data. Learn more…


Add a comment
Comments
0 comments on the analysis KLEROS - PNK/USD - 1H